5 Things A Title Search Can Tell You

5 Things A Title Search Can Tell You

When you’re buying or selling property, proving ownership, or refinancing a mortgage, conducting a title search for a Certificate of Title is essential. But what is a Certificate of Title, and what detail can it provide about a property?

A Certificate of Title (sometimes referred to as a title deed or a land title) serves as a public and legal record of land ownership, including interests and restrictions on the land.

In the past, these certificates were physical papers, but with the availability of e-Conveyancing, they are now available electronically.

In Australia, state land registries hold title information. This title information is accessible through a Title Search from an authorised provider in as little as 60 seconds. A title search unveils crucial details, including property owner/s names, land restrictions, mortgage and lease details, and other important information.

Here are five key revelations from a title search:

1. Ownership Details

The Certificate of Title discloses the names of all landowners, specifying the type of ownership—either tenants in common or joint tenants.

This information is vital for understanding the property’s ownership structure and potential implications.

2. Easements

Easements, granting non-owners the right to use land for a specific purpose, are highlighted.

Common easements include drainage, service access and right of way.

Being aware of these easements is crucial as they can impact land use and construction possibilities.

3. Covenants

Covenants, acting as guidelines or restrictions on the land, outline limitations on construction.

Developers create covenants to maintain quality and aesthetics. Understanding these rules is essential for compliance during property alterations.

4. Caveats

Caveats serve as warnings that others have an interest in the property, preventing certain actions like selling.

A caveat is lodged with the state land registry, signaling potential claims to the property.

Buyers must be vigilant for caveats as they indicate potential issues with the property’s title.

5. Mortgages

The presence of a mortgage is disclosed – if one exists – indicating that the bank holds the Certificate of Title instead of the property owner.

This information is crucial for buyers, as the seller must discharge the mortgage before settlement to avoid delays.

Conducting a title search provides a comprehensive understanding of a property’s legal and ownership status, and the careful consideration of these details not only ensures compliance but also helps avoid potential issues, to help individuals, investors or businesses make more informed decisions in real estate transactions. 

Subscribe to our newsletter

Subscribe to receive the latest blogs and data listings direct to your inbox.

Read more blogs from The Proptech Cloud

Crafting a Storm Surge and Hurricane Risk Rating for Coastal Properties

A high-level approach to developing a storm surge and hurricane risk rating system to guide stakeholders with a vested interest in coastal properties.

How Proptech Is Revolutionising Real Estate

Proptech is the dynamic intersection of property and technology, and it’s reshaping real estate. And there’s still a huge potential for growth.

What is the Australian Statistical Geography Standard (ASGS)?

The ASGS is used to better understand where people live and how communities are formed.

How to Incorporate Mesh Blocks into Datasets

Mesh blocks can enhance the precision and relevance of geospatial and proptech analyses. Here are some tips and steps to incorporate mesh blocks into datasets.

Australia’s Migration Trends: Where Are People Moving To?

This detailed visual analysis for Australia’s major capital cities breaks down how net migration trends are evolving across different regions.

Understanding Housing Affordability: Key Metrics and Statistics

Understanding Housing Affordability: Key Metrics and Statistics

Housing affordability is a significant concern in many parts of the world, affecting the quality of life and economic wellbeing of individuals and families.

Professor Nicole Gurran from the School of Architecture, Design and Planning says governments around the world are searching for solutions to fix housing affordability, with two opposing schools of thought seeing the solutions as:

  1. Increasing supply. Those in support of this point of view see housing as more expensive because there’s not enough new supply. They see land use regulation and planning processes as restrictive to new construction, adding costly delays and uncertainty to the development process.
  2. On the flipside, others argue that ‘demand side’ factors underlying global house price inflation, such as low cost credit under financial deregulation, or government incentives to encourage property investment are being ignored. They highlight the political influence of property industry groups sustaining housing demand while advocating for reduced regulations. Some even suggest that extensive rezoning reforms may trigger surges in redevelopment and gentrification, potentially displacing individuals with lower incomes.

To truly understand the dynamics of housing affordability we need to take a detailed look at a range of different metrics and statistics to gain a full picture.

Shedding light on these crucial measures can offer insights for homebuyers, policymakers, real estate professionals, and urban planners.

1. Median and Average Home Prices

These figures provide a baseline for understanding the cost of purchasing a home in a particular area, with the median providing a middle point and the average presenting an overall trend.

2. Price-to-Income Ratio

This critical ratio compares home prices to average household incomes. A higher ratio suggests that homes are less affordable relative to income.

3. Housing Affordability Measures

A Housing Affordability Index (HAI) assesses whether a typical family can afford the mortgage on a median-priced home, based on their income. An index above 100 indicates greater affordability.

The issue with the HAI is that it primarily focuses on purchase affordability.

The Australian Institute of Health and Welfare (AIHW) broadens what they classify as housing costs in measuring housing affordability.

AIHW defines housing costs as

the sum of rent payments, rate payments (water and general), and housing–related mortgage payments”,

AIHW expresses housing affordability as

“the ratio of housing costs to gross household income”,

While housing stress is typically described as

lower-income households that spend more than 30% of gross income on housing costs“.

The second measure is a more comprehensive approach which considers a range of housing costs, the complexity of housing affordability and its impact on households.

4. Rent-to-Income Ratio

Rent-to-Income Ratio compares a tenant’s monthly rent to their gross monthly income expressed as a ratio. For those in the rental market, this ratio measures how much of a household’s income is spent on rent, with higher values indicating less affordability.

Rental property

5. Mortgage Interest Rates

Interest rates directly affect the cost of borrowing money for home purchases.

An increase in mortgage interest rates typically mean an increase in mortgage repayments, which can negatively impact affordability.

While a reduction in rates typically means reduced mortgage repayments, which may improve affordability.

6. Mortgage Payment as a Percentage of Income

Mortgage payment as a percentage of income is an important measure of affordability by demonstrating the burden of mortgage payments relative to a household’s income.

This percentage is calculated by dividing monthly mortgage repayments by gross monthly wages. 

The recommended figure is 28% of pre-tax income. Or in other words, no more than 28% of gross monthly income should go towards monthly mortgage repayments.

7. Homeownership Rates

Broad changes in homeownership rates can signal shifts in affordability, and the overall health of the housing market. 

To gain an idea of homeownership rates in Australia, AIHW shares a view of Home ownership and housing tenure in Australia.

8. Cost of Living

Several measures are published to calculate and help gauge changes in the cost of living. Changes in cost of living impacts our household purchasing power and has implications for housing demand. 

The main ways we measure cost of living is the Consumer Price Index.

Consumer Price Index (CPI)

According to the Australian Bureau of Statistics, CPI is a measure of the average change over time in the prices paid by households for a fixed basket of goods and services (which is grouped into 11 categories: Food and non-alcoholic beverages, Alcohol and tobacco, Clothing and footwear, Housing, Furnishings, household equipment and services, Health, Transport, Communication, Recreation and culture, Education, and Insurance and financial services).

 It’s important to note that the calculation of CPI does not include the cost of buying established dwellings, nor mortgage repayments. However, it does include rents, the cost of new dwellings (excluding value of land) and major alterations and additions to dwellings. 

Included in CPI

Not included in CPI

  • Rent
  • Cost of new dwellings (excluding value of land)
  • Major alterations and additions to dwellings
  • Rates and charges
  • Utilities
  • The cost of buying established dwellings
  • The cost of purchasing land
  • Mortgage repayments
  • Costs associated with servicing a mortgage
Consumer Price Index

9. Gini Coefficient of Home Prices

The Gini Coefficient statistical measure is typically used as a measure of income inequality, although it can be used to assess inequality in various other contexts, including home values in a real estate market.

A Gini index of 0 represents perfect equality, while an index of 100 implies perfect inequality.

This measure can indicate the inequality in home values within a market, with higher values suggesting greater disparity.

10. Building Permits and Housing Starts

Building permits and housing starts are indicators of building activity and housing supply.  They can signal future market changes which may impact affordability.

11. Vacancy Rates

A vacancy rate is a measure of the percentage of all rental properties that are currently vacant and available for rent.

Fluctuations in vacancy rates can impact rental prices, as elevated rates often correlate with decreased rents, and conversely, lower vacancy rates may lead to higher rental prices.

12. Debt-to-Income Ratio

An individual’s Debt-to-Income Ratio is calculated by taking their total debt and dividing it by their annual income.

This ratio reflects a person’s capacity to afford housing in light of their existing debts.

14. Population Growth and Urbanisation

Rapid population increases or urbanisation can heighten housing demand, affecting affordability.

A Multifaceted View of Housing Affordability

These range of metrics offer a multifaceted and broader view of housing affordability, reflecting the many factors that impact pricing, while implicitly highlighting the complexities of the housing market.

They’re essential for making informed decisions, shaping policies, and understanding market trends.

By keeping a close eye on these indicators, stakeholders can better navigate the challenges and opportunities within the housing sector.

Subscribe to our newsletter

Subscribe to receive the latest blogs and data listings direct to your inbox.

Read more blogs from The Proptech Cloud

Crafting a Storm Surge and Hurricane Risk Rating for Coastal Properties

A high-level approach to developing a storm surge and hurricane risk rating system to guide stakeholders with a vested interest in coastal properties.

How Proptech Is Revolutionising Real Estate

Proptech is the dynamic intersection of property and technology, and it’s reshaping real estate. And there’s still a huge potential for growth.

What is the Australian Statistical Geography Standard (ASGS)?

The ASGS is used to better understand where people live and how communities are formed.

How to Incorporate Mesh Blocks into Datasets

Mesh blocks can enhance the precision and relevance of geospatial and proptech analyses. Here are some tips and steps to incorporate mesh blocks into datasets.

Australia’s Migration Trends: Where Are People Moving To?

This detailed visual analysis for Australia’s major capital cities breaks down how net migration trends are evolving across different regions.

How to Develop a Comprehensive Wildfire Risk Rating for Properties

How to Develop a Comprehensive Wildfire Risk Rating for Properties

The Australian 2019/2020 bushfire season is one of the world’s worst in recent memory. It began in November 2019 in New South Wales and spread across Victoria, Western Australia, South Australia, and the Australian Capital Territory. The extensive fires, fueled by high temperatures and prolonged dry conditions, led to widespread devastation, with a number of lives lost, thousands of homes destroyed or damaged and billions of dollars worth of agricultural damage.

Australia frequently experiences both bushfires and grass fires.

These fires are a natural and integral part of Australia’s environment. Many Australian plants and animals have evolved to not only survive but also benefit from the effects of fire, with some flora depending on fire to assist in its reproduction and growth.

According to Australia State of the Environment 2021, bushfires include all types of fires in the bush – prescribed burns for weed control, cultural burns, fuel reduction burns and wildfires.

Wildfires are bushfires that are out of control, whether they are managed fires that have escaped control or fires that were not deliberately lit.

With the increasing prevalence of bushfires and wildfires globally, assessing the risk they pose to people, properties and infrastructure has become more critical than ever.

Steps to Develop a Wildfire Score Rating

A Wildfire Risk Rating score provides a quantifiable measure of this risk, guiding governments, financial institutions, insurance companies, homeowners, developers and buyers in making informed decisions.

Here we’ll outline a high-level structured approach to developing a comprehensive wildfire risk rating for properties.

1. Defining scoring criteria and scale

Firstly, we establish a scoring scale, typically from 1 (lowest risk) to 5 or 10 (highest risk). It’s important to define clear criteria that contribute to bushfire or wildfire risk, ensuring a comprehensive evaluation.

2. Key factors to consider

Several factors play a pivotal role in determining fire risks:

    • Location and topography

      Proximity to fire-prone areas and the property’s topography can significantly influence risk levels.
      Tools like Archistar have features to determine if your site is in a bushfire-prone zone. With built-in bushfire layers, Archistar can provide accurate and reliable data.

    • Vegetation and landscaping

      The type and maintenance of vegetation around a property are crucial, as some plants are more flammable than others.Australia’s unique geography and climate makes it prone to bushfires. In Australia, hazard reduction burns or prescribed burns are controlled fires undertaken by fire agencies, land managers or by rural landholders to remove vegetation. These are often conducted ahead of the warmer summer months as a means of mitigating the impact of bushfires and reducing fire risks.

      Examples include Forest Fire Management Victoria Reducing Bushfire Risk program and the ACT Government’s Fire Management Policies and Plans aim to reduce the risk of bushfires.

    • Climate and weather patterns

      Weather is a key driver of bushfire ignitions, with a number of factors affecting wildfire activity. Many factors contribute to fire weather, such as a lack of rainfall in the lead-up period, low humidity, strong winds and high temperatures, which all contribute to fire risk on any given day. They can also increase moisture stress on vegetation in the lead-up period.

      Local climate, current and historical weather patterns, including wind conditions and drought frequency, are critical considerations in the development of a Wildfire Risk Rating.

Weather patterns
  • Historical wildfire data

    Historical wildfire data is important because understanding past wildfire occurrences in the area helps predict future risks.
    There is a range of open data sources for historical bushfire data. In Australia, the Australian Government shares a range of bushfire related datasets on data.gov.au and University of NSW shares 100 Years of Bushfire Data.

    This type of data, combined with other data sets conveniently accessible from the one location, the Snowflake Marketplace, can help to develop a fuller picture about historical wildfire in specific areas. For example:

    • Access and infrastructure

      Good access for firefighters and robust utility infrastructure are important for fire response and prevention.

    3. Data collection and analysis

    Gathering relevant data, such as GIS mapping, climate data, and historical fire records, is the next step.

    The Proptech Cloud curates a range of useful datasets available on Snowflake Marketplace to make this process easier.

    Analysing this data allows us to assign a sub-score to each factor based on our scale.

    4. Assigning weights to each factor and calculating the overall score

    Each factor is assigned a weight according to its impact on bushfire risk.

    This step is essential to ensure that more critical factors have a greater influence on the overall score.

    By combining these sub-scores and considering their respective weights, we calculate the property’s overall Wildfire Risk Rating.

    5. Validation and adjustment

    It’s important to validate the scoring system against historical bush and wildfire incidents and expert opinions, adjusting it as necessary for accuracy and reliability.

    6. Regular updates

    As environmental conditions and land use change, it’s important to regularly update the scoring system to maintain its relevance and accuracy.

    The Role of Wildfire Risk Rating

    A well-structured wildfire risk rating is an invaluable tool, helping property stakeholders to understand, assess, and mitigate the risks posed by bushfires. By adopting this methodical approach, we can enhance our preparedness and response to this growing environmental threat.

    Subscribe to our newsletter

    Subscribe to receive the latest blogs and data listings direct to your inbox.

    Read more blogs from The Proptech Cloud

    Crafting a Storm Surge and Hurricane Risk Rating for Coastal Properties

    A high-level approach to developing a storm surge and hurricane risk rating system to guide stakeholders with a vested interest in coastal properties.

    How Proptech Is Revolutionising Real Estate

    Proptech is the dynamic intersection of property and technology, and it’s reshaping real estate. And there’s still a huge potential for growth.

    What is the Australian Statistical Geography Standard (ASGS)?

    The ASGS is used to better understand where people live and how communities are formed.

    How to Incorporate Mesh Blocks into Datasets

    Mesh blocks can enhance the precision and relevance of geospatial and proptech analyses. Here are some tips and steps to incorporate mesh blocks into datasets.

    Australia’s Migration Trends: Where Are People Moving To?

    This detailed visual analysis for Australia’s major capital cities breaks down how net migration trends are evolving across different regions.

    Environmental Risks in Real Estate: Essential Metrics for Assessment

    Environmental Risks in Real Estate: Essential Metrics for Assessment

    Driven by greater awareness and demand, environmental considerations are increasingly at the forefront of property development and investment.

    Environmental factors can significantly impact site selection, regulatory compliance, property values, safety, infrastructure, sustainability, insurance costs, and the overall desirability of real estate.

    To adequately build resilient properties for our future, understanding and assessing environmental risks in real estate is crucial.

    Examining the key metrics and statistics used to measure these risks can also provide valuable insights for property stakeholders who are building climate intelligence as a means of value creation and strategic differentiation in the real estate industry.

    On the other hand, the real estate industry contributes approximately 39% of total global emissions. This highlights how factors as broad as the choice of building materials, construction methods, real estate planning and development can influence and help to mitigate global climate change and environmental risk.

    Environmental assessment metrics provide important intel to stakeholders and businesses in and around the real estate industry. 

    Here we examine the top 16 key metrics used in assessing environmental risk in real estate.

    1. Flood Risk Assessment

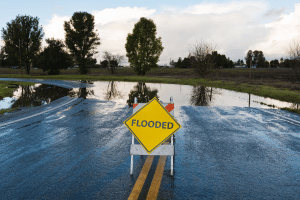
    Managing flood risk is an important aspect of adapting to global climate change and flood risk assessments have become an important part of risk management practices. The estimation of risk is somewhat challenging and involves careful consideration of a number of varying factors such as location, historical flood data, and elevation.

    Flood risk is a concern, especially for properties near water bodies.

    Flood

    2. Earthquake Risk Score

    In earthquake-prone areas, earthquake risk score is vital. It evaluates the probability of earthquakes and their potential impact, factoring in seismic activity and building standards.

    Earthquake risk metrics can support stakeholders in developing risk reduction measures such as emergency response plans, building design codes, or insurance-related decisions.

    3. Wildfire Risk Rating

    Properties in or near wilderness areas must consider the risk of wildfires. This rating looks at location, vegetation, and climate conditions. There are a number of data and solutions in the market that help decision makers with deeper location intelligence insights, such as CoreLogic with their climate risk solutions and Precisely with their wildfire risk data.

    Then there are those protech innovators who actively incorporate environmental risks into their solutions, such as Nearmap who’ve recently acquired BetterView, will also be integrating risk ratings for data decisions given the ever-changing nature of bush fires, floods, and other disasters.

    4. Storm Surge and Tsunami Risk

    While storm surges and tsunamis are caused by different events, they both have the potential to cause significant harm and damage, such as substantial erosion of beaches and coastal highways, and waves pose a threat to boats and buildings along the shoreline. As the surging waters move inland, rivers and lakes may experience adverse effects, contributing to the escalation of flood levels.

    Coastal properties are evaluated for their vulnerability to storm surge and tsunamis, crucial in today’s changing climate.

    Sea levels

    5. Sea Level Rise Projections

    With climate change, assessing the long-term risk of sea level rise is essential for coastal real estate investments.

    Climate Central’s Coastal Risk Screening Tool is a handy tool for quick future projections.

    6. Air Quality Index (AQI)

    Air pollution stands as the most significant environmental threat to global public health, resulting in an approximate annual total of 7 million premature deaths.

    AQI impacts property desirability and occupant health, making it a significant factor in urban and industrial areas.

    7. Soil Contamination Levels

    Soil contamination can limit property use and affect value, necessitating thorough assessments.

    Australian soil information is collected by government and held by the states and territories. Soil Science Australia, the national soil science body, shares a handy list of Soils Data, Maps and Information Sources for reference.

    Soil

    8. Water Quality Assessments

    Our water systems, including surface and groundwater, catchments, as well as estuarine and marine bodies, constitute intricate ecological networks that we engage with daily. These waterways and wetlands play an important role in:

    • Providing drinking water
    • Supporting irrigation and agriculture
    • Receiving and purifying effluent and stormwater
    • Facilitating recreational and commercial activities such as fishing and boating.

    The quality of local water sources is a key consideration, as it affects usability and desirability

    9. Heat Island Effect

    Urban areas influence the surrounding atmosphere and engage with climate processes, resulting in distinct microclimates within cities.

    This heat island phenomenon leads to urban areas experiencing notably higher temperatures compared to their surroundings, particularly in areas with limited green cover and increased hard surfaces that absorb, retain, and emit heat.

    Urban heat islands can increase energy costs and affect living conditions, and is an important factor in urban planning.

    10. Noise Pollution Levels

    The World Health Organization (WHO) recognises noise pollution—defined as unfavorable noise caused by human activity—as an underestimated threat that can cause a number of short- and long-term health problems.

    As well as contributing to health, noise pollution is often seen as a less-than-desirable attribute contributing to liveability.

    Properties exposed to high noise levels from traffic or industry can affect their value.

    11. Environmental Regulation Compliance

    In Australia, compliance with legislation including protection of threatened plants, animals and ecosystems, wildlife trade, hazardous waste, air quality and monitoring compliance with the conditions of approvals granted under the Environment Protection and Biodiversity Conservation Act 1999 (EPBC Act) is conducted by The Department of Climate Change, Energy, the Environment and Water.

    Compliance with environmental regulations is critical to avoid legal issues and maintain property value.

    Soil erosion

    12. Land Stability and Erosion Rates

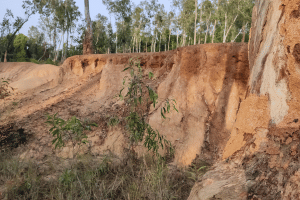
    Land stability and erosion rates is affected by soils, surface cover, topography, and climate; all of which are interrelated.

    Particularly in areas with unstable soils or steep terrain, assessing the risk of landslides or erosion is essential for many aspects of real estate such as site selection, development planning and insurance, while these risks can also have an influence on property valuations.

    13. Proximity to Hazardous Facilities

    Numerous research studies have indicated a correlation between living in close proximity to sites with hazardous wastes, industrial facilities, pesticide-treated cropland, busy roadways, nuclear power plants, and gas stations or repair shops, result in an increased likelihood of detrimental health effects.

    Government may form regulations and implement procedures for permits and enforcement to limit pollution.

    As such, properties in close proximity may face increased regulations, risks or insurance costs.

    14. Biodiversity and Wildlife Protection Areas

    With a sustained need for housing, urban planners and conservation managers are consistently exploring alternative strategies for residential development that aim to reduce adverse effects on biodiversity and ecosystem functioning.

    Thus, proximity to protected areas can limit development options and affect property value.

    Biodiversity

    15. Carbon Footprint Analysis

    Climate change is already underway, with an escalating impact that is increasingly affecting all of us around the globe.

    Without immediate and systemic action to address its destructive consequences, the impact is expected to be substantial.

    For greater visibility into the environmental footprint of transactions and impacts of our consumption and production activities, organisations such as FootprintLab provide current, credible and commercially ready carbon data. This information can aid consumers, producers and governments in decision-making that aligns with their sustainability goals.

    Managing carbon emissions from the construction industry is one crucial step in limiting these effects on climate change and a property’s carbon footprint is becoming a significant factor in light of global climate concerns.

    16. Sustainability Certifications

    A green building certification is a verification process ensuring that a building is designed and constructed to enhance energy efficiency, decrease water usage, foster a healthier indoor environment, manage resources and waste effectively, and limit environmental impact.

    The process generally requires adherence to specific guidelines and criteria, often assessed by an accredited third-party organisation, leading to the certification of the building.

    There are different green building certifications around the globe, with LEED in the United States, BREEAM in the United Kingdom and NABERS in Australia, each with its own set of criteria and scoring systems.

    Properties with these certifications are often seen as less risky and more desirable.

    The Proptech Cloud’s Environment and Energy Efficiency Data provides energy supply data and NABERS energy rating data to guide decisions on energy sourcing as part of a robust sustainability strategy.

    Managing Environmental Risks

    Understanding and mitigating environmental risks is important in the real estate sector. By using these metrics, stakeholders can make informed decisions, adapt to environmental challenges, uncover business opportunities and invest in sustainable and resilient properties.

    As the world continues to focus on environmental sustainability, these considerations will become increasingly integral to real estate assessment and development.

    Subscribe to our newsletter

    Subscribe to receive the latest blogs and data listings direct to your inbox.

    Read more blogs from The Proptech Cloud

    Crafting a Storm Surge and Hurricane Risk Rating for Coastal Properties

    A high-level approach to developing a storm surge and hurricane risk rating system to guide stakeholders with a vested interest in coastal properties.

    How Proptech Is Revolutionising Real Estate

    Proptech is the dynamic intersection of property and technology, and it’s reshaping real estate. And there’s still a huge potential for growth.

    What is the Australian Statistical Geography Standard (ASGS)?

    The ASGS is used to better understand where people live and how communities are formed.

    How to Incorporate Mesh Blocks into Datasets

    Mesh blocks can enhance the precision and relevance of geospatial and proptech analyses. Here are some tips and steps to incorporate mesh blocks into datasets.

    Australia’s Migration Trends: Where Are People Moving To?

    This detailed visual analysis for Australia’s major capital cities breaks down how net migration trends are evolving across different regions.

    Understanding the Real Estate Market: Key Metrics and Statistics

    Understanding the Real Estate Market: Key Metrics and Statistics

    Navigating the real estate market can be complex, whether you’re a buyer, seller, investor, or industry analyst. One of the keys to understanding this dynamic market is to familiarise yourself with the various metrics and statistics that measure real estate activity.

    These indicators provide invaluable insights into market trends, pricing dynamics, and overall economic health.

    We’ll cover some of the most common metrics used in real estate analysis to help stakeholders better understand this dynamic market.

    1. Sales Volume

    Sales volume indicates the total number of properties sold in a specific period. This metric is a primary measure of market activity. Relatively high sales volumes often point to a robust market, while lower volumes may signal a slowdown.

    A number of organisations offer this data in Australia, usually by state or even postcode for a laser focused lens on particular areas of interest:

    • HtAG
    • CoreLogic
    Property sales

    2. Median Sale Price

    The median sale price identifies the middle value in a list of property sale prices. This metric offers a realistic snapshot of the market’s pricing level, avoiding the skewing effect of extremely high or low prices.

    3. Average Sale Price

    The average sale price is calculated by dividing the total value of all sales by the number of transactions.

    The average sale price provides a broader perspective of the market’s general pricing trends.

    For sale

    4. Days on Market (DOM)

    As its name suggests, DOM tracks the number of days a property spends on the market before being sold.

    Shorter DOM periods typically indicate a seller’s market, whereas longer DOMs suggest a buyer’s market.

    5. Listing Inventory

    Inventory is the count of the number of properties which are actively marketed and listed for sale, also referred to as “active listings” or “homes for sale.”

    Understanding the number of properties available for sale at any given time helps gauge the supply side of the market equation.

    6. Absorption Rate

    The absorption rate is a real estate metric that assesses how quickly homes are being sold in a particular market over a set period. It is determined by dividing the number of homes sold during that time by the total available homes.

    Additionally, this formula can be flipped to determine how long it would take to sell the existing supply.

    This rate measures the speed at which the market is ‘absorbing’ or selling off its current inventory, offering insight into market demand.

    7. Price per Square Metre (or Square Foot)

    This metric is calculated by dividing the sale price by the property’s total square metres (or footage).

    This metric is handy because it allows for a direct comparison between different properties of varying prices and floor space.

    8. Rent Prices and Yields

    Rental yield is calculated by subtracting the total costs of your investment from the income generated by renting out your property. Typically represented as a percentage, a higher yield indicates increased cash flow and a more favourable return on investment.

    For investment properties, monitoring rent prices and yields (rental income as a percentage of property value) is crucial.

    Soil

    9. Foreclosure Rates

    Foreclosure happens when a lender seizes a property because the person who took out a mortgage fails to make the required payments.

    Foreclosure involves a legal procedure where the property’s title is transferred from the homeowner (borrower) to the lender, who then sells the property.

    The purpose of selling the property is for the lender to recover the outstanding loan amount.

    The process is usually lengthy and doesn’t simply occur because a homeowner misses just one repayment; it occurs with more substantial lapse in payments.

    The number of properties in foreclosure can indicate both the health of the real estate market and broader economic conditions.

    10. Mortgage Interest Rates

    Mortgage interest is the cost a lender charges for taking the risk of lending you money. The mortgage interest rate directly affects your repayments – the higher the interest rate, the bigger your payments will be.

    This is why mortgage interest rates on home loans significantly influence buyer demand and market dynamics.

    11. Construction Starts

    The number of new building projects indicates future supply and market confidence.

    The Proptech Cloud’s data listing contains statistics for Australian construction activity helpful for planning, demand forecasting and construction cycle timing.

    The Australian government publishes building activity visualisations which shows dwelling construction trends over time, and the Australian Bureau of Statistics provides estimates of value of building work and number of dwellings commenced, completed, under construction and in the pipeline.

    Soil erosion

    12. Building Permits Issued

    Building permits are papers which confirm that a planned building follows the rules set by authorities. It’s a written approval from a building surveyor, either private or municipal.

    This statistic reflects the level of future construction activity and developer sentiment.

    13. Vacancy Rates

    Vacancy rates indicate how many rental homes in an area are currently empty and available for rent. To find this rate, take the number of empty homes in that area and divide it by the total number of homes available for rent.

    In rental or commercial properties, the percentage of unoccupied units at a given time can signal market health.

    14. Capitalisation Rate (Cap Rate)

    Especially relevant in commercial real estate, the cap rate helps estimate the return on an investment property.

    To find the cap rate, take the property’s yearly income (after subtracting expenses) and divide it by the property’s value. This rate is useful for comparing how good of an investment a property is compared to others in the same area.

    If a property has a higher cap rate, it means there’s more risk involved. And usually, when the cap rate is higher, the property’s value is lower because its yearly income is less.

    Biodiversity

    The Use of Property Metrics and Statistics

    These metrics provide distinctive perspectives on the real estate market. Depending on your role—whether you’re a buyer, renter, investor, realtor, or other stakeholder in real estate—each metric carries unique value, caters to different requirements, and provides diverse insights.

    By understanding and analysing these indicators, stakeholders can make more informed decisions, predict market trends, and grasp the market’s broader economic implications.

    Regardless of whether you’re a seasoned professional or a curious observer, keeping an eye on these statistics is key to understanding the complexities of the real estate world.

    Subscribe to our newsletter

    Subscribe to receive the latest blogs and data listings direct to your inbox.

    Read more blogs from The Proptech Cloud

    Crafting a Storm Surge and Hurricane Risk Rating for Coastal Properties

    A high-level approach to developing a storm surge and hurricane risk rating system to guide stakeholders with a vested interest in coastal properties.

    How Proptech Is Revolutionising Real Estate

    Proptech is the dynamic intersection of property and technology, and it’s reshaping real estate. And there’s still a huge potential for growth.

    What is the Australian Statistical Geography Standard (ASGS)?

    The ASGS is used to better understand where people live and how communities are formed.

    How to Incorporate Mesh Blocks into Datasets

    Mesh blocks can enhance the precision and relevance of geospatial and proptech analyses. Here are some tips and steps to incorporate mesh blocks into datasets.

    Australia’s Migration Trends: Where Are People Moving To?

    This detailed visual analysis for Australia’s major capital cities breaks down how net migration trends are evolving across different regions.