How Proptech Is Revolutionising Real Estate

How Proptech Is Revolutionising Real Estate

Real estate, the world’s largest asset class, valued at a staggering $7.56 trillion, has long been a sleeping giant when it comes to technological innovation. But now, it’s waking up. Recent years have witnessed an unprecedented surge in proptech.

What is Proptech?

PropTech is short for Property Technology which, as its name suggests, is the dynamic intersection of property and technology.

Broadly, it refers to the innovative use of technology in the real estate industry and covers a wide range of tech solutions and innovations aimed at disrupting and digitising various aspects of the real estate sector, including property management, leasing, sales, construction, investment and others.

Proptech tackles key issues in how we use and benefit from real estate. It’s already streamlining processes and transactions, creating new opportunities, addressing pain points, cutting costs, enhancing connectivity, productivity and boosting convenience for residents, owners, landlords and other stakeholders.

Why the Surge in Proptech?

Several key factors have contributed to the rapid rise of proptech. The COVID-19 pandemic significantly accelerated the need for virtual, no-touch experiences, driving technological innovation across the sector.

Technological advancements with practical applications in real estate have also played a crucial role. Examples of innovations include:

  • Virtual Reality (VR) and Augmented Reality (AR) enhancing property viewing experiences.
  • Artificial Intelligence (AI) and Machine Learning (ML) providing data-driven insights and personalised recommendations.
  • Internet of Things (IoT) enabling smart home features and efficient property management.
  • Blockchain Technology allowing fractional property ownership, offering new ways for buyers and sellers to connect and potentially cutting costs by removing intermediaries out of the transaction process.
  • Drone Technology offering virtual tours and aerial views,

Increased connectivity and the availability of real estate data, have improved customer experiences and enabled faster, more informed decisions in real estate transactions, planning and development.

Regulatory changes have also revolutionised the way real estate operates.

Regulatory changes serve as a catalyst for proptech innovation. By creating new challenges and setting higher standards, regulations drive the development of advanced technologies and solutions that help businesses comply, operate more efficiently, and enhance their services. This continuous push for innovation ensures that the real estate industry evolves to meet modern demands.

The pressing issue of housing affordability has spurred creative approaches to real estate ownership and investment too. Proptech and financial technology (fintech) are democratising property investment, making it more accessible through crowdfunding platforms, fractional ownership, and Real Estate Investment Trusts (REITs).

The potential for disruption and innovation in the real estate sector has attracted significant investor interest. Corporate venture capital units and accelerator programs further support and fast-track proptech startup funding.

Proptech’s Potential to Reimagine Real Estate

Proptech has gained significant traction in recent years as real estate professionals and investors recognise the potential of technology to disrupt.

According to PropTechBuzz, hundreds of Australian proptech startups are leveraging the power of advanced technologies like big data, AI, AR and generating over $1.4 billion of direct economic output.

Yet, we are only on the cusp of proptech’s true potential.

Signs show that this fledgling industry has yet to reach its pinnacle.

A recent Deloitte survey Global Real Estate Outlook Survey of real estate owners and investors across North America, Europe, and Asia/Pacific reveals:

  • Many real estate firms address years of amassed technical debt by ramping up technology capabilities. 59% of respondents say they do not have the data, processes, and internal controls necessary to comply with these regulations and expect it will take significant effort to reach compliance.
  • Many real estate firms aren’t ready to meet environmental, social, and governance (ESG) regulations. 61% admit their firms’ core technology infrastructures still rely on legacy systems. However, nearly half are making efforts to modernise.

Barriers to progress still exist.

A survey of 216 Australian property companies from 2021 by the Property Council of Australia and Yardi Systems show that

  • There is the perception that solutions must be specially developed or customised (34%).
  • 26% of respondents see changing existing behaviours as the biggest obstacle to overcome, followed by cost (23%) and time constraints (11%).

The Future of Proptech

The future of proptech is looking bright.

As new technology, trends, and other contributing factors converge to accelerate innovation in the real estate (and its neighbouring) sectors, new ideas take flight and promise to disrupt traditional processes.

Proptech brings exciting benefits, boosting the real estate industry’s digital presence, productivity and enhancing experiences for everyone involved.

It fosters innovation and automation, adding convenience, efficiency, transparency and accuracy to administrative and operational tasks.

Additionally, proptech holds the promise of better access to data and analytics and the integration of sustainability practices.

As technology continues to advance and consumer preferences evolve, proptech is likely to play an increasingly prominent role in shaping the future of the real estate industry.

Proptech revolutionising real estate

Subscribe to our newsletter

Subscribe to receive the latest blogs and data listings direct to your inbox.

Read more blogs from The Proptech Cloud

Crafting a Storm Surge and Hurricane Risk Rating for Coastal Properties

A high-level approach to developing a storm surge and hurricane risk rating system to guide stakeholders with a vested interest in coastal properties.

How Proptech Is Revolutionising Real Estate

Proptech is the dynamic intersection of property and technology, and it’s reshaping real estate. And there’s still a huge potential for growth.

What is the Australian Statistical Geography Standard (ASGS)?

The ASGS is used to better understand where people live and how communities are formed.

How to Incorporate Mesh Blocks into Datasets

Mesh blocks can enhance the precision and relevance of geospatial and proptech analyses. Here are some tips and steps to incorporate mesh blocks into datasets.

Australia’s Migration Trends: Where Are People Moving To?

This detailed visual analysis for Australia’s major capital cities breaks down how net migration trends are evolving across different regions.

What is the Australian Statistical Geography Standard (ASGS)?

What is the Australian Statistical Geography Standard (ASGS)?

What is the Australian Statistical Geography Standard (ASGS)?

The Australian Statistical Geography Standard (ASGS) is essentially a framework used to classify and organise geographical areas across Australia for the purpose of collecting, analysing, and disseminating statistics.

Mesh Block Changes

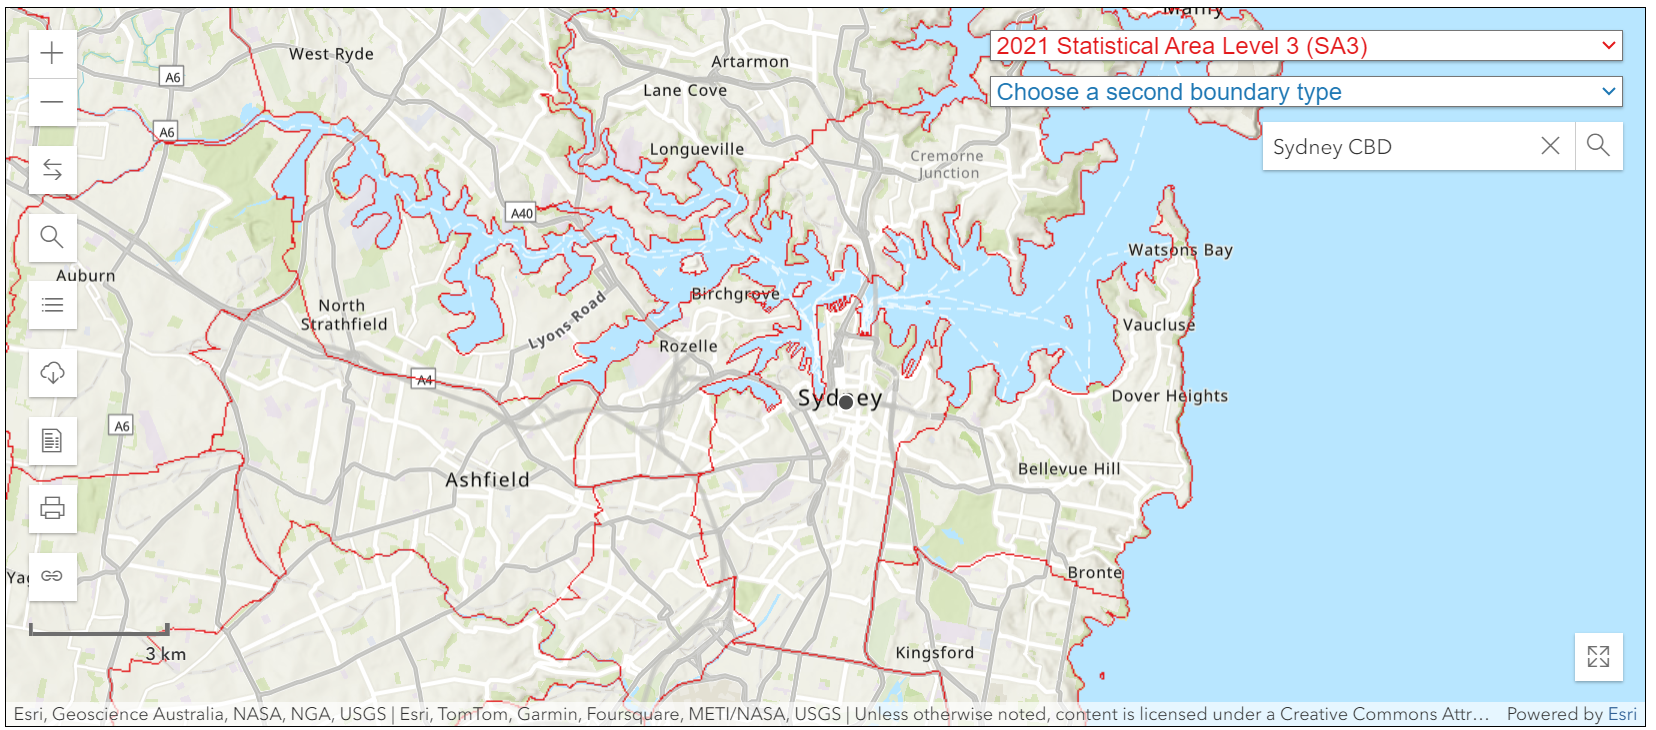
Edition 3 ASGS 2021 – Sydney Statistical Area 3 (SA3)
Source: ABS Maps

By organising Australia into a system of statistical areas, the ASGS can be used to perform standardised location-based analysis on things that matter to your business. For example, where your customers live or shop, where your competitors operate, where you have business assets located or where weather patterns are observed.

The ASGS is a detailed way of representing Australia’s geographical diversity in statistical data.

By dividing the country into hierarchical levels of statistical areas, ranging from broad regions to specific localities, it allows accurate and meaningful analysis of various data, including population, economic and environmental statistics – ultimately, to better understand where people live and how communities are formed.

The ASGS was introduced in 2011 to replace the previous Australian Standard Geographical Classification (ASGC).

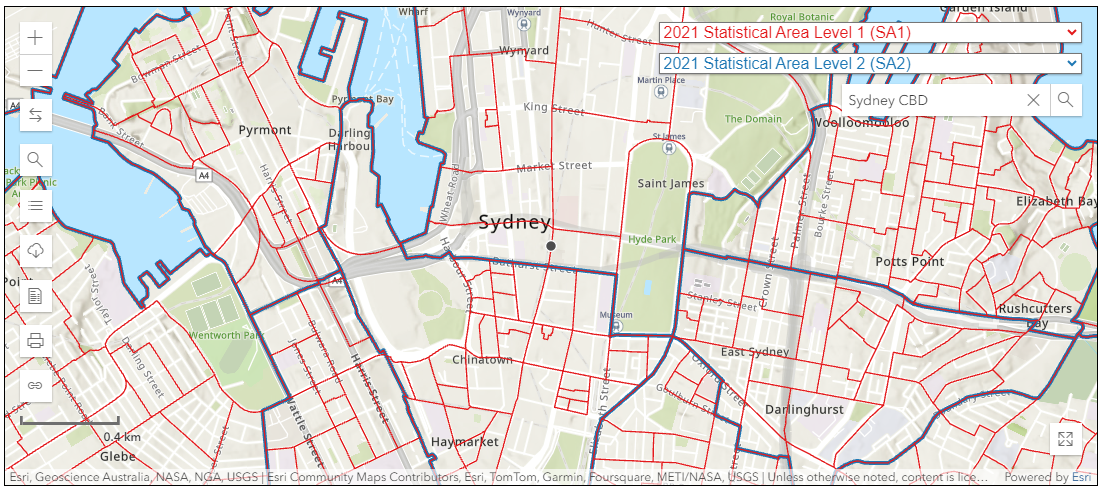
Sydney CBD SA1 & SA2

Edition 3 ASGS 2021 – Sydney Central Business District (CBD) Statistical Area 1 (SA1) and Statistical Area 2 (SA2).
Source: ABS Maps

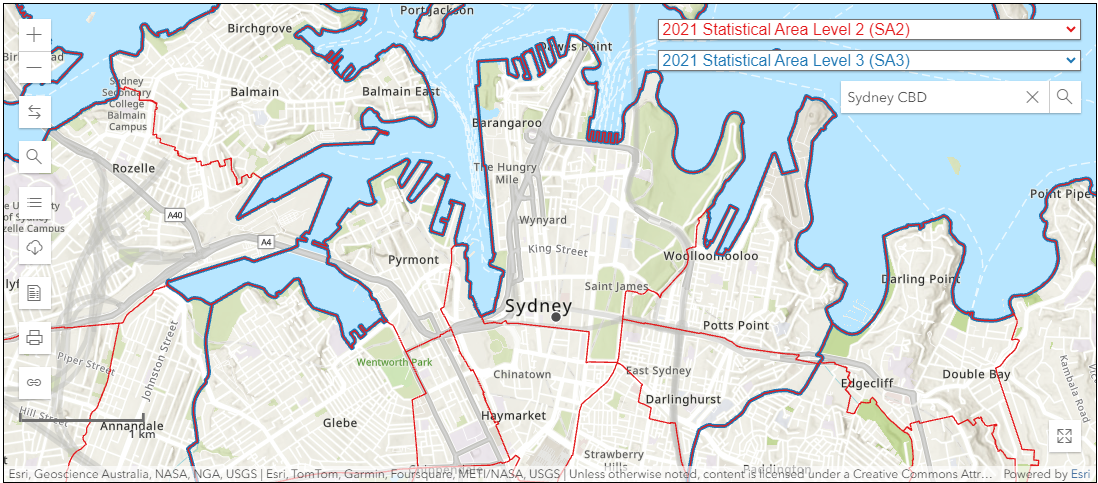
Sydney CBD SA2 & SA3

Edition 3 ASGS 2021 – Sydney CBD Statistical Area 2 (SA2) and Statistical Area 3 (SA3).
Source: ABS Maps

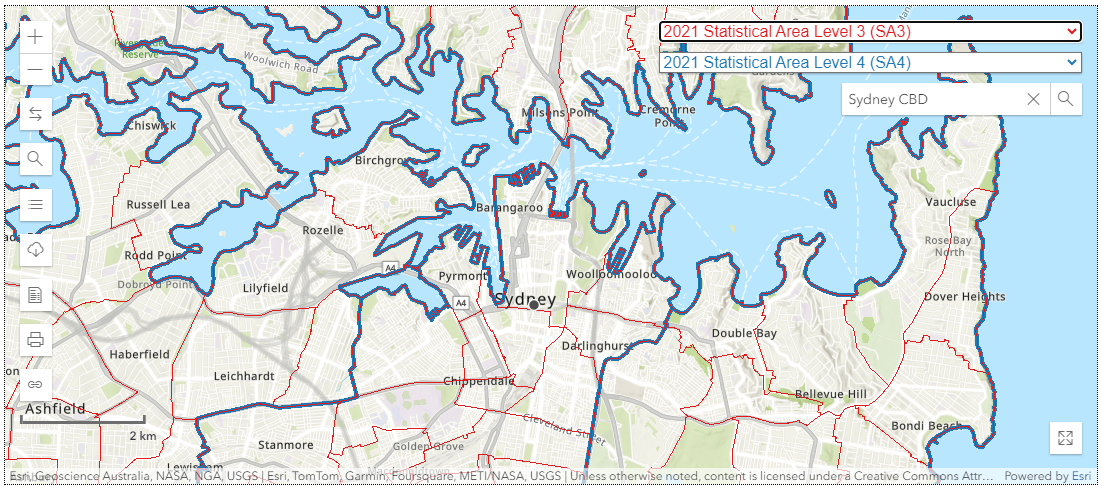
Sydney CBD SA3 & SA4

Edition 3 ASGS 2021 – Sydney CBD Statistical Area 3 (SA3) and Statistical Area 4 (SA4).
Source: ABS Maps

Updates of the Australian Statistical Geography Standard (ASGS)

The ASGS is revised and refreshed every five years to reflect changes in the population, demographics, the country’s development and geographic boundaries to ensure it remains relevant and useful for statistical purposes.

The third edition, linked to the 2021 Census, began rolling out in July 2021 and includes updates to various geographic categorisations, ending with the Remoteness Structure in March 2023.

The Australian Bureau of Statistics (ABS) oversees the ASGS and reviews it to ensure it meets current needs, incorporating feedback from public consultation. Additionally, they offer the online tool, ABS Maps, for exploring and comparing these statistical areas.

ASGS Edition 3 hierarchy of statistical areas

The Australian Statistical Geography Standard (ASGS) is represented through a hierarchical framework of statistical areas. 

The ASGS is split into ABS and non ABS Structures. Of these, ABS Structures are geographies designed by the ABS for the purposes of releasing and the analysis of statistics.

The hierarchy is made up of several nested levels, which enables a flexible and consistent approach to understanding and managing geographic data. 

Here is the ASGS Edition 3 Structures as published by the Australian Bureau of Statistics:


Main Structure and Greater Capital City Statistical Areas

  • Mesh Blocks: The smallest geographic unit, designed to cover all of Australia without gaps or overlaps. Mesh Blocks are the building blocks for larger statistical areas. Read more about Mesh Blocks>
  • Statistical Areas Level 1 (SA1): Groups of Mesh Blocks with populations between 200 and 800 people. They are used in the Census of Population and Housing.
  • Statistical Areas Level 2 (SA2): Aggregates of SA1s, generally with populations between 3,000 and 25,000 people. They represent functional areas that interact socially and economically.
  • Statistical Areas Level 3 (SA3): Groups of SA2s, reflecting regional cities and large urban transport hubs.
  • Statistical Areas Level 4 (SA4): Aggregates of SA3s, representing labour markets or regions with similar socioeconomic characteristics.
  • Greater Capital City Statistical Areas (GCCSA): Represent each of the eight state and territory capital cities.

Special Purpose Regions

Indigenous Structure

  • Indigenous Regions and Areas: Defined to facilitate the statistical analysis of the distribution of Aboriginal and Torres Strait Islander populations. The three hierarchical levels are: Indigenous Locations, Indigenous Areas and Indigenous Regions.

Remoteness Structure

  • Remoteness Areas: Classify areas based on their remoteness from services and population centres. The five remoteness classes are: Major Cities, Inner Regional, Outer Regional, Remote and Very Remote.

Significant Urban Areas, Section of State, Urban Centres and Localities

  • Urban Centres and Localities (UCLs): Define urban and rural areas based on population size and density.
  • Section of State (SOS): SOS groups the UCLs into classes of urban areas based on population size.

  • Classifying urban areas in several different ways is to allow statistical data to be made available to Australian towns and cities and for statistical analysis.

Non ABS Structures

  • Non ABS Structures: These are administrative regions that are not defined or maintained by the ABS. They include eight geographies: Local Government Areas, State Electoral Divisions, Commonwealth Electoral Divisions, Destination Zones, Postal Areas, Suburbs and Localities, Australian Drainage Divisions and Tourism Regions.

What tools can be used for representing and analysing ASGS?

These tools collectively offer a comprehensive approach to representing and analysing ASGS data.

They provide the necessary geographic context and detailed spatial data required for thorough analysis.

A combination of these resources can enable data professionals to enhance their analytical capabilities and produce insightful visualisations to support planning and informed decision making.


  • ABS Maps: An online tool provided by the Australian Bureau of Statistics (ABS) that allows users to explore and compare different statistical areas defined by the ASGS.
  • Geographic Information System (GIS) Files: GIS is a framework for gathering, managing, and analysing spatial and geographic data, encompassing a broad range of tools and functionalities. GIS files (formats may include shapefiles, GeoJSON, and KMLare) available for download, allowing for detailed spatial analysis using software like ArcGIS or QGIS.
  • Online Data Portals: Platforms such as the ABS Data Explorer or Australian National Map provide access to a variety of geographic data layers. This allows users to visualise and download data in different formats for analysis.
  • Statistical and Data Visualisation Software: R, Python (with libraries like Geopandas and Folium), and Tableau can be used to import ASGS data for advanced statistical analysis and visualisation, enabling the creation of custom maps and visual representations of the data.
  • Spatial Databases: Databases such as PostGIS that are optimised for storing and querying spatial data and facilitates efficient management and analysis of large geographic datasets.
  • Printed Maps and Documentation: Detailed maps and explanatory notes published by the ABS, outlining the boundaries and characteristics of each statistical area.
Analysis

What is the ASGS used for?

One of ASGS’s primary uses is for the Census, the study of Australia’s population.

The ASGS is integral to Australia’s Census as it defines geographic boundaries, facilitates detailed data collection and enumeration, enables comprehensive data analysis and reporting, and supports informed decision-making, resource allocation, policy making and planning by government agencies.

However it is also used broadly by the Australian Bureau of Statistics (ABS) and other entities.

The ASGS is versatile enough to support a wide array of activities involving the accurate collection of geographic and statistical data across Australia, making it a fundamental element in analysis.


  • Detailed demographics: The ASGS allows businesses to segment customers based on detailed geographic and demographic data. By using Statistical Areas (SA1 to SA4), companies can identify distinct customer groups within specific regions, tailoring marketing strategies and product offerings to the unique characteristics of each segment.
  • Targeted marketing: Businesses can use Mesh Blocks or SA1 regions to create hyper-local marketing campaigns, ensuring that promotional efforts are targeted towards areas with the highest potential for engagement and conversion.
  • Real estate and urban planning: The ASGS provides a robust framework for organising geographic areas to satisfy a broad range of uses in real estate. It can be used to enhance analysis of localities for a better understanding of local demographic through to reporting of property-related data. Examples include: analysis of housing trends, planning of urban developments, identifying growth areas or conducting property valuations with a clear understanding of geographic distinctions.
  • Accurate market data aggregation: The hierarchical structure of the ASGS enables businesses to aggregate and report market data accurately across various geographic levels, from local neighborhoods (SA1) to larger regions (SA4). This helps in understanding market trends and consumer behavior across different areas.
  • Market trend analysis: By comparing data across different Census periods using consistent ASGS boundaries, businesses can track market trends and demographic shifts, aiding in long-term strategic planning and investment decisions.
  • Business and market analysis: Companies leverage the ASGS for market analysis, site selection and strategic planning as it can help businesses understand demographic trends and geographical distributions of markets to inform targeted marketing and business expansion strategies.
  • Retail demand forecasting: Retailers can use ASGS data to forecast demand for products in different geographic areas. By understanding population density, age distribution, and income levels within mesh blocks or SA2 areas, businesses can optimise inventory levels to match local demand.
  • Supply chain efficiency: The ASGS framework helps retailers plan efficient distribution routes and manage stock levels more effectively, ensuring that products are available where they are needed most without overstocking or stockouts.
  • Competitor analysis: Businesses can use ASGS-defined regions to map out the geographic locations of competitors, analysing their market coverage and identifying potential gaps or opportunities for expansion.
  • Market share estimation: By integrating ASGS data with sales and demographic information, companies can estimate market share within specific regions, helping to assess competitive strengths and weaknesses.
  • Environmental risk assessment: The ASGS allows for precise mapping of environmental risks such as flood zones, bushfire-prone areas, and pollution levels. By overlaying environmental data with population and infrastructure data from the ASGS, businesses can assess the potential impact of environmental risks on their operations.
  • Environmental regulation compliance and planning: Companies can use ASGS data to ensure compliance with environmental regulations and to plan mitigation strategies for at-risk areas. This helps in safeguarding assets and maintaining operational continuity.
  • Research and academia: Researchers and academics use the ASGS for conducting spatial analysis and regional studies, allowing detailed investigations into socio-economic, environmental, and demographic conditions across different regions.

The essential role of ASGS

The Australian Statistical Geography Standard (ASGS) plays a foundational role in statistical geography, allowing users to analyse and visualise statistics based on location. Its extensive applications, regular updates, and strong endorsement by the ABS ensure its implementation and integrity.

As such, the ASGS remains an essential framework and a mainstay in Australian geographic and statistical analysis—an indispensable tool for ensuring the accuracy, consistency, and relevance of geographic data across various domains.

How to Incorporate Mesh Blocks into Datasets

Incorporating mesh blocks into datasets involves several steps to ensure seamless integration and effective utilisation of geographical information. Here’s a guide on how to incorporate mesh blocks into datasets.

Subscribe to our newsletter

Subscribe to receive the latest blogs and data listings direct to your inbox.
Read more blogs from The Proptech Cloud

Crafting a Storm Surge and Hurricane Risk Rating for Coastal Properties

A high-level approach to developing a storm surge and hurricane risk rating system to guide stakeholders with a vested interest in coastal properties.

How Proptech Is Revolutionising Real Estate

Proptech is the dynamic intersection of property and technology, and it’s reshaping real estate. And there’s still a huge potential for growth.

What is the Australian Statistical Geography Standard (ASGS)?

The ASGS is used to better understand where people live and how communities are formed.

How to Incorporate Mesh Blocks into Datasets

Mesh blocks can enhance the precision and relevance of geospatial and proptech analyses. Here are some tips and steps to incorporate mesh blocks into datasets.

Australia’s Migration Trends: Where Are People Moving To?

This detailed visual analysis for Australia’s major capital cities breaks down how net migration trends are evolving across different regions.

What Are Mesh Blocks & How Are They Used in Real Estate

What Are Mesh Blocks & How Are They Used in Real Estate

What are Mesh Blocks?

As defined by Australian Bureau of Statistics (ABS), mesh blocks are the smallest geographical area of the Australian Statistical Geography Standard (ASGS) and ABS’s classification of Australia into a hierarchy of statistical areas.

Mesh Blocks are essentially a set of geographic boundaries designed to segment Australia into very small areas. These boundaries are used to apply a systematic grid over the entire country, dividing it into tiny sections called Mesh Blocks.

Each Mesh Block is a polygon that outlines a specific piece of land, which can range from a single block in a city to a vast, sparsely populated area in the countryside.

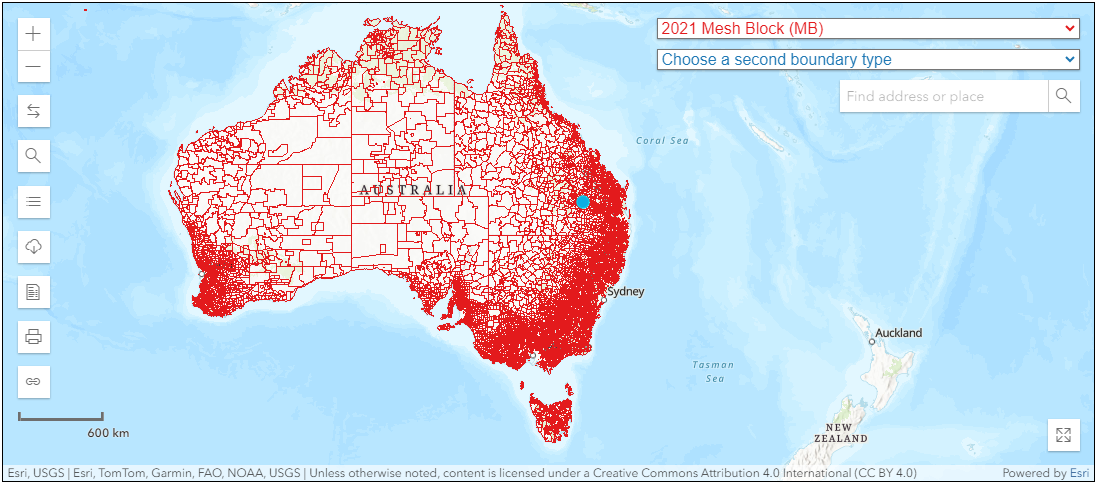
In 2021, the ABS reported 368,286 Mesh Blocks covering the whole of Australia without gaps or overlaps.

Mesh Blocks covering the whole of Australia. Source: ABS Maps


Mesh Block design

Mesh Blocks for the current ASGS Edition 3 are designed according to a standard set of design criteria first developed for ASGS 2011.

Most Mesh Blocks are designed to contain 30 to 60 dwellings, although some low dwelling count Mesh Blocks exist. They are permitted in order to account for other design criteria.

The reasons for the minimum dwelling count of Mesh Blocks is so they’re small enough to aggregate to a wide range of areas, allow comparisons between geographic regions but also prevent accidentally exposing confidential information of individuals or businesses.


Mesh Block changes

Mesh Blocks are updated (or redesigned) every 5 years to stay relevant.

Mesh Blocks for the current ASGS Edition 3 was redesigned to ensure it still meets the design criteria first developed for ASGS 2011 and reflects the growth and change in Australia’s population, economy and infrastructure.

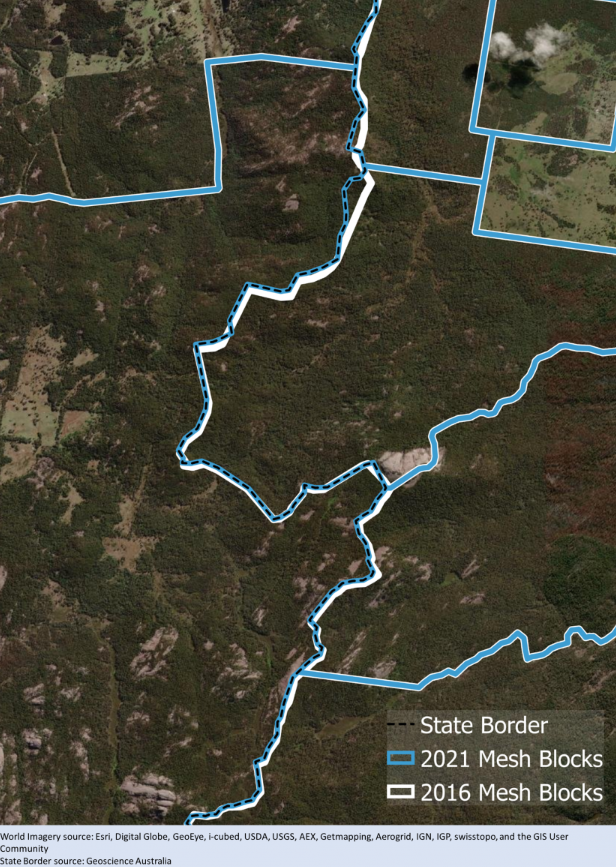
Mesh Block Changes

Example of Mesh Block change along the border of Queensland and New South Wales. Source: Australian Bureau of Statistics

How are Mesh Blocks created?

Each Mesh Block is assigned a unique numerical code or identifier. This code is used to reference the Mesh Block in statistical databases and geographic information systems (GIS).

The format of the code can vary but often includes digits that signify hierarchical levels of geography.

In Australia, Mesh Block identifiers are 11-digit codes.

The 11-digit Mesh Block code comprises: State and Territory identifier (1 digit), and a Mesh Block identifier (10 digits).

How are Mesh Blocks used?

The ABS does not and cannot provide detailed segmentation data (Census data) that can be directly connected to individuals or businesses. Instead, they provide anonymised and aggregated data against geographic areas. Mesh Blocks are the smallest geographic area that the ABS provide statistics against, so it offers population and dwelling counts at a hyper-local level – this is particularly useful for Census analysis.

These geographic boundaries allow for the aggregation of data from individual Mesh Blocks into larger geographic units, such as suburbs, towns, cities, and regions. This hierarchical structuring makes it possible to analyse data at various levels, from very detailed local information to broader regional or national trends.

Most businesses, including proptechs, looking to augment their analysis with population segmentation data will adopt Mesh Blocks as their default level geographic unit to gain the highest level of accuracy. The popularity of Mesh Blocks mean many businesses will use it for geographic statistics regardless of whether or not the Census data is being leveraged.

What role do Mesh Blocks play in proptech?

Mesh Blocks play a vital role in Proptech, geospatial data, and the real estate industry in Australia. Some example uses include:

Granular geographical data

Since Mesh Blocks are the smallest geographical units, providing a granular level of detail in geographic data, its precision is valuable for analysing real estate trends at a hyper-local level.

Accurate small area statistics

Mesh Blocks are designed to fulfill the need for accurate small area statistics. In Proptech, having precise data at this level is instrumental for understanding localised property markets, demographics, and trends.

Spatial mapping and analysis

Geospatial data, including Mesh Blocks, facilitates spatial mapping and analysis. Proptech platforms can leverage this data to visualise and analyse property-related information, helping users make more informed decisions based on geographical insights.

Enhanced property valuation

Proptech applications can utilise Mesh Blocks to refine property valuation models. The data on dwellings and residents at this level allows for a more nuanced understanding of property values, considering localised factors.

Land use identification

Mesh blocks broadly identify land use, such as residential, commercial, industrial, parkland, and so forth. Land use information is valuable for proptechs involved in property development, urban planning, and investment strategies.

Targeted marketing and outreach

Proptech businesses can use Mesh Block data to tailor marketing and outreach strategies to specific geographical areas. Understanding the demographics and dwelling counts at this level allows for targeted and effective location-based campaigns.

Census-driven insights

The inclusion of Census data within Mesh Blocks, such as the count of usual residents and dwelling types, provides proptech platforms with up-to-date demographic information. This can aid market analysis, customer profiling, and investment strategies.

Integration with digital boundary files

The availability of Mesh Block boundaries in digital boundary files enhances their usability in Proptech applications. These files can be readily integrated into geospatial systems, making it easier for developers and analysts to work with this geographical data.

The foundational building blocks in real estate

Mesh Blocks are foundational building blocks for geospatial and proptech applications, providing granularity and accuracy for understanding local real estate markets, demographics and land use.

To aid proptechs, The Proptech Cloud offers its Geography – Boundaries & Insights dataset which includes all mesh blocks and their spatial areas for analysis and location-based visualisation of statistics.

The integration of this important information can enhance the precision and relevance of analyses within the proptech and real estate sectors. Read our following blog to learn how to incorporate Mesh Blocks into datasets.

How to Incorporate Mesh Blocks into Datasets

Incorporating mesh blocks into datasets involves several steps to ensure seamless integration and effective utilisation of geographical information. Here’s a guide on how to incorporate mesh blocks into datasets.

Subscribe to our newsletter

Subscribe to receive the latest blogs and data listings direct to your inbox.
Read more blogs from The Proptech Cloud

Crafting a Storm Surge and Hurricane Risk Rating for Coastal Properties

A high-level approach to developing a storm surge and hurricane risk rating system to guide stakeholders with a vested interest in coastal properties.

How Proptech Is Revolutionising Real Estate

Proptech is the dynamic intersection of property and technology, and it’s reshaping real estate. And there’s still a huge potential for growth.

What is the Australian Statistical Geography Standard (ASGS)?

The ASGS is used to better understand where people live and how communities are formed.

How to Incorporate Mesh Blocks into Datasets

Mesh blocks can enhance the precision and relevance of geospatial and proptech analyses. Here are some tips and steps to incorporate mesh blocks into datasets.

Australia’s Migration Trends: Where Are People Moving To?

This detailed visual analysis for Australia’s major capital cities breaks down how net migration trends are evolving across different regions.

Understanding Auction Clearance Rates: Why Do Calculations Differ?

Understanding Auction Clearance Rates: Why Do Calculations Differ?

Auction clearance rates can serve as a barometer of Australia’s real estate market strength, particularly across its major cities.

These rates are generally a superficial gauge of market strength, because private treaty is still the most common means of property sale in some cities. Nevertheless, property predictions can be drawn when auction clearance rates are analysed alongside other factors and data points.

Clearance rates for Australia’s major real estate markets can be helpful for proptechs who leverage data, analytics, and technology to advance various aspects of the real estate industry.

What Is An Auction Clearance Rate?

The auction clearance rate typically represents the percentage of properties that sold on its advertised auction date in a specific market versus the number of properties that didn’t sell during a particular time frame (typically a week or month).

How Are Auction Clearance Rates Calculated?

There are variations in how clearance rates are calculated and reported, so it’s important to consider this and understand your data provider’s calculations. The variance in calculations means these metrics offer different views and are not interchangeable.


Variations to the Calculation

Calculation

Calculation (%)

Basic calculationPercentage of properties sold on auction date during a particular period (week or month)Basic calculation of auction clearance rates
Includes properties sold prior to and during auctionPercentage of properties sold prior to plus on auction date during a particular period (week or month)Basic Calculation + Properties sold prior to auction
Includes properties sold prior to, during and after auctionPercentage of properties sold prior to auction plus on auction date plus after auction date during a particular period (week or month)Sold prior + at + after auction Calculation 


What Do Auction Clearance Rates Tell Us?

Auction clearance rates are a crucial market indicator of real estate activity by gauging the numbers of buyers and sellers in a specific market during a certain time frame.

Generally, higher auction clearance rates indicate a higher buyer demand for property in that market, limited supply of available properties and/or with an increased likelihood of rising price, i.e. a hot market for sellers.

Conversely, low auction clearance rates indicates weak buyer demand, possible over-supply of properties and chance of reduced prices which is more favourable to buyers.

In Sydney and Melbourne, a clearance rate above 70% signals a seller’s market, below 60% suggests a buyer’s market, and 60-70% indicates balance.

But the true significance of auction clearance rates lies in its contextual analysis alongside factors such as listing numbers, days on market, withdrawn auctions, fluctuations and regional disparities.

By tracking these rates alongside additional metrics, analysts can anticipate market direction, and measure buyer and seller confidence.

Where Can I Find Clearance Rates For Australia’s Capital Cities?

Auction clearance rates in Australia are reported on a weekly basis.

Some organisations collect data from sales agents and aggregate the data by city and region, such as:

Some news outlets, auction houses and real estate agencies may also publish auction clearance rates for specific regions. Industry reports and analyses related to real estate may also compile this data to provide a comprehensive view into trends.

How Important Are Auction Clearance Rates?

For anyone involved in or impacted by the real estate market, auction clearance rates are an important indicator of demand levels, market sentiment, and potential shifts in property values. But when comparing available data, its crucial to understand the methodology behind the calculations of auction clearance rates.

Auction clearance rates should be used as part of a comprehensive analysis alongside other property data, localised research, and broader market factors. While auction clearance rates offer valuable insights into the direction of the property market, they are just one of many factors to consider, and a holistic approach incorporating various data points is recommended for a thorough understanding of market conditions.

How Might Auction Clearance Rates Be Used By Proptechs?

While not exhaustive, these are a few examples of how auction clearance rates might be used by proptechs and businesses working with real estate data.

  • By analysing clearance rates and buyer demand, price trends can be used to gauge competitiveness of the market. These could all be incorporated into tool development or software development, it could be used to optimise platform features, or to guide content creation to engage users.
  • Combining this information with localised data for property investment, integrating clearance rate data into risk assessment models could allow for more informed investment decisions.
  • Property valuation models could be enhanced with the use of real-time clearance rate data which provides more accurate and dynamic property valuations in areas of high auction activity.

Subscribe to our newsletter

Subscribe to receive the latest blogs and data listings direct to your inbox.
Read more blogs from The Proptech Cloud

Crafting a Storm Surge and Hurricane Risk Rating for Coastal Properties

A high-level approach to developing a storm surge and hurricane risk rating system to guide stakeholders with a vested interest in coastal properties.

How Proptech Is Revolutionising Real Estate

Proptech is the dynamic intersection of property and technology, and it’s reshaping real estate. And there’s still a huge potential for growth.

What is the Australian Statistical Geography Standard (ASGS)?

The ASGS is used to better understand where people live and how communities are formed.

How to Incorporate Mesh Blocks into Datasets

Mesh blocks can enhance the precision and relevance of geospatial and proptech analyses. Here are some tips and steps to incorporate mesh blocks into datasets.

Australia’s Migration Trends: Where Are People Moving To?

This detailed visual analysis for Australia’s major capital cities breaks down how net migration trends are evolving across different regions.

5 Things A Title Search Can Tell You

5 Things A Title Search Can Tell You

When you’re buying or selling property, proving ownership, or refinancing a mortgage, conducting a title search for a Certificate of Title is essential. But what is a Certificate of Title, and what detail can it provide about a property?

A Certificate of Title (sometimes referred to as a title deed or a land title) serves as a public and legal record of land ownership, including interests and restrictions on the land.

In the past, these certificates were physical papers, but with the availability of e-Conveyancing, they are now available electronically.

In Australia, state land registries hold title information. This title information is accessible through a Title Search from an authorised provider in as little as 60 seconds. A title search unveils crucial details, including property owner/s names, land restrictions, mortgage and lease details, and other important information.

Here are five key revelations from a title search:

1. Ownership Details

The Certificate of Title discloses the names of all landowners, specifying the type of ownership—either tenants in common or joint tenants.

This information is vital for understanding the property’s ownership structure and potential implications.

2. Easements

Easements, granting non-owners the right to use land for a specific purpose, are highlighted.

Common easements include drainage, service access and right of way.

Being aware of these easements is crucial as they can impact land use and construction possibilities.

3. Covenants

Covenants, acting as guidelines or restrictions on the land, outline limitations on construction.

Developers create covenants to maintain quality and aesthetics. Understanding these rules is essential for compliance during property alterations.

4. Caveats

Caveats serve as warnings that others have an interest in the property, preventing certain actions like selling.

A caveat is lodged with the state land registry, signaling potential claims to the property.

Buyers must be vigilant for caveats as they indicate potential issues with the property’s title.

5. Mortgages

The presence of a mortgage is disclosed – if one exists – indicating that the bank holds the Certificate of Title instead of the property owner.

This information is crucial for buyers, as the seller must discharge the mortgage before settlement to avoid delays.

Conducting a title search provides a comprehensive understanding of a property’s legal and ownership status, and the careful consideration of these details not only ensures compliance but also helps avoid potential issues, to help individuals, investors or businesses make more informed decisions in real estate transactions. 

Subscribe to our newsletter

Subscribe to receive the latest blogs and data listings direct to your inbox.
Read more blogs from The Proptech Cloud

Crafting a Storm Surge and Hurricane Risk Rating for Coastal Properties

A high-level approach to developing a storm surge and hurricane risk rating system to guide stakeholders with a vested interest in coastal properties.

How Proptech Is Revolutionising Real Estate

Proptech is the dynamic intersection of property and technology, and it’s reshaping real estate. And there’s still a huge potential for growth.

What is the Australian Statistical Geography Standard (ASGS)?

The ASGS is used to better understand where people live and how communities are formed.

How to Incorporate Mesh Blocks into Datasets

Mesh blocks can enhance the precision and relevance of geospatial and proptech analyses. Here are some tips and steps to incorporate mesh blocks into datasets.

Australia’s Migration Trends: Where Are People Moving To?

This detailed visual analysis for Australia’s major capital cities breaks down how net migration trends are evolving across different regions.

Understanding Housing Affordability: Key Metrics and Statistics

Understanding Housing Affordability: Key Metrics and Statistics

Housing affordability is a significant concern in many parts of the world, affecting the quality of life and economic wellbeing of individuals and families.

Professor Nicole Gurran from the School of Architecture, Design and Planning says governments around the world are searching for solutions to fix housing affordability, with two opposing schools of thought seeing the solutions as:

  1. Increasing supply. Those in support of this point of view see housing as more expensive because there’s not enough new supply. They see land use regulation and planning processes as restrictive to new construction, adding costly delays and uncertainty to the development process.
  2. On the flipside, others argue that ‘demand side’ factors underlying global house price inflation, such as low cost credit under financial deregulation, or government incentives to encourage property investment are being ignored. They highlight the political influence of property industry groups sustaining housing demand while advocating for reduced regulations. Some even suggest that extensive rezoning reforms may trigger surges in redevelopment and gentrification, potentially displacing individuals with lower incomes.

To truly understand the dynamics of housing affordability we need to take a detailed look at a range of different metrics and statistics to gain a full picture.

Shedding light on these crucial measures can offer insights for homebuyers, policymakers, real estate professionals, and urban planners.

1. Median and Average Home Prices

These figures provide a baseline for understanding the cost of purchasing a home in a particular area, with the median providing a middle point and the average presenting an overall trend.

2. Price-to-Income Ratio

This critical ratio compares home prices to average household incomes. A higher ratio suggests that homes are less affordable relative to income.

3. Housing Affordability Measures

A Housing Affordability Index (HAI) assesses whether a typical family can afford the mortgage on a median-priced home, based on their income. An index above 100 indicates greater affordability.

The issue with the HAI is that it primarily focuses on purchase affordability.

The Australian Institute of Health and Welfare (AIHW) broadens what they classify as housing costs in measuring housing affordability.

AIHW defines housing costs as

the sum of rent payments, rate payments (water and general), and housing–related mortgage payments”,

AIHW expresses housing affordability as

“the ratio of housing costs to gross household income”,

While housing stress is typically described as

lower-income households that spend more than 30% of gross income on housing costs“.

The second measure is a more comprehensive approach which considers a range of housing costs, the complexity of housing affordability and its impact on households.

4. Rent-to-Income Ratio

Rent-to-Income Ratio compares a tenant’s monthly rent to their gross monthly income expressed as a ratio. For those in the rental market, this ratio measures how much of a household’s income is spent on rent, with higher values indicating less affordability.

Rental property

5. Mortgage Interest Rates

Interest rates directly affect the cost of borrowing money for home purchases.

An increase in mortgage interest rates typically mean an increase in mortgage repayments, which can negatively impact affordability.

While a reduction in rates typically means reduced mortgage repayments, which may improve affordability.

6. Mortgage Payment as a Percentage of Income

Mortgage payment as a percentage of income is an important measure of affordability by demonstrating the burden of mortgage payments relative to a household’s income.

This percentage is calculated by dividing monthly mortgage repayments by gross monthly wages. 

The recommended figure is 28% of pre-tax income. Or in other words, no more than 28% of gross monthly income should go towards monthly mortgage repayments.

7. Homeownership Rates

Broad changes in homeownership rates can signal shifts in affordability, and the overall health of the housing market. 

To gain an idea of homeownership rates in Australia, AIHW shares a view of Home ownership and housing tenure in Australia.

8. Cost of Living

Several measures are published to calculate and help gauge changes in the cost of living. Changes in cost of living impacts our household purchasing power and has implications for housing demand. 

The main ways we measure cost of living is the Consumer Price Index.

Consumer Price Index (CPI)

According to the Australian Bureau of Statistics, CPI is a measure of the average change over time in the prices paid by households for a fixed basket of goods and services (which is grouped into 11 categories: Food and non-alcoholic beverages, Alcohol and tobacco, Clothing and footwear, Housing, Furnishings, household equipment and services, Health, Transport, Communication, Recreation and culture, Education, and Insurance and financial services).

 It’s important to note that the calculation of CPI does not include the cost of buying established dwellings, nor mortgage repayments. However, it does include rents, the cost of new dwellings (excluding value of land) and major alterations and additions to dwellings. 

Included in CPI

Not included in CPI

  • Rent
  • Cost of new dwellings (excluding value of land)
  • Major alterations and additions to dwellings
  • Rates and charges
  • Utilities
  • The cost of buying established dwellings
  • The cost of purchasing land
  • Mortgage repayments
  • Costs associated with servicing a mortgage
Consumer Price Index

9. Gini Coefficient of Home Prices

The Gini Coefficient statistical measure is typically used as a measure of income inequality, although it can be used to assess inequality in various other contexts, including home values in a real estate market.

A Gini index of 0 represents perfect equality, while an index of 100 implies perfect inequality.

This measure can indicate the inequality in home values within a market, with higher values suggesting greater disparity.

10. Building Permits and Housing Starts

Building permits and housing starts are indicators of building activity and housing supply.  They can signal future market changes which may impact affordability.

11. Vacancy Rates

A vacancy rate is a measure of the percentage of all rental properties that are currently vacant and available for rent.

Fluctuations in vacancy rates can impact rental prices, as elevated rates often correlate with decreased rents, and conversely, lower vacancy rates may lead to higher rental prices.

12. Debt-to-Income Ratio

An individual’s Debt-to-Income Ratio is calculated by taking their total debt and dividing it by their annual income.

This ratio reflects a person’s capacity to afford housing in light of their existing debts.

14. Population Growth and Urbanisation

Rapid population increases or urbanisation can heighten housing demand, affecting affordability.

A Multifaceted View of Housing Affordability

These range of metrics offer a multifaceted and broader view of housing affordability, reflecting the many factors that impact pricing, while implicitly highlighting the complexities of the housing market.

They’re essential for making informed decisions, shaping policies, and understanding market trends.

By keeping a close eye on these indicators, stakeholders can better navigate the challenges and opportunities within the housing sector.

Subscribe to our newsletter

Subscribe to receive the latest blogs and data listings direct to your inbox.
Read more blogs from The Proptech Cloud

Crafting a Storm Surge and Hurricane Risk Rating for Coastal Properties

A high-level approach to developing a storm surge and hurricane risk rating system to guide stakeholders with a vested interest in coastal properties.

How Proptech Is Revolutionising Real Estate

Proptech is the dynamic intersection of property and technology, and it’s reshaping real estate. And there’s still a huge potential for growth.

What is the Australian Statistical Geography Standard (ASGS)?

The ASGS is used to better understand where people live and how communities are formed.

How to Incorporate Mesh Blocks into Datasets

Mesh blocks can enhance the precision and relevance of geospatial and proptech analyses. Here are some tips and steps to incorporate mesh blocks into datasets.

Australia’s Migration Trends: Where Are People Moving To?

This detailed visual analysis for Australia’s major capital cities breaks down how net migration trends are evolving across different regions.