How to Incorporate Mesh Blocks into Datasets
Mesh Blocks in real estate and proptech applications
Mesh Blocks are useful for geospatial and proptech applications, providing granularity and accuracy for understanding local real estate markets, demographics and land use.
The integration of Mesh Blocks into datasets can enhance the precision and relevance of analyses within the proptech and real estate sectors.
Useful in geospatial data and census analyses, embedding Mesh Blocks into digital boundaries enhances their usability in various applications.
We will cover the steps to incorporate mesh blocks into data sets below.
What are Mesh Blocks and how are they used in real estate?
Mesh Blocks are foundational building blocks for geospatial and proptech applications, providing granularity and accuracy for understanding local real estate markets, demographics and land use.
How to incorporate Mesh Blocks into datasets
Incorporating Mesh Block into datasets involves several steps to ensure seamless integration and effective utilisation of geographical information. Here’s a guide on how to incorporate Mesh Blocks into datasets:
Step 1: Data Collection
Gather relevant data that aligns with Mesh Blocks.
This may include demographic information, property values, land use details, or any other dataset that can be associated with specific geographical areas.
Step 2: Download Mesh Block Boundaries
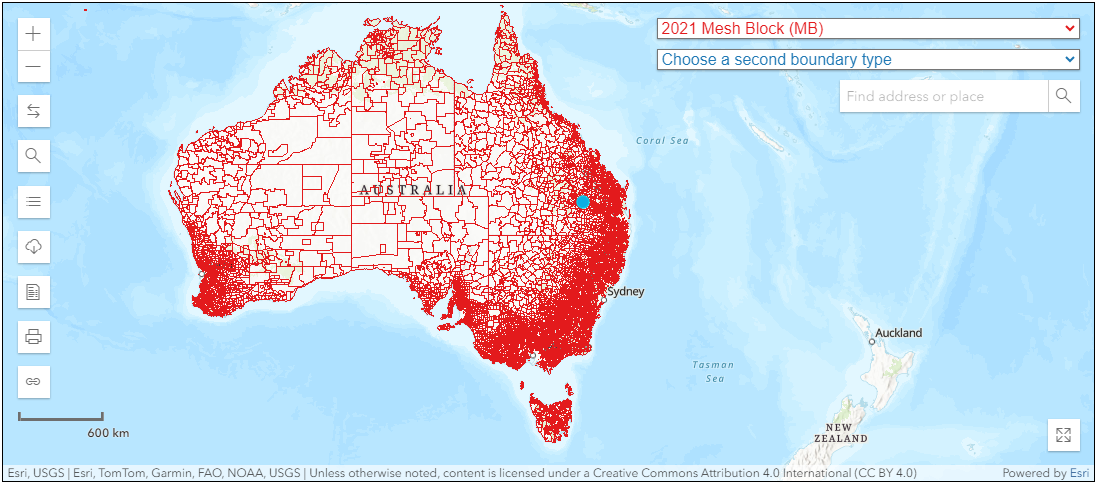
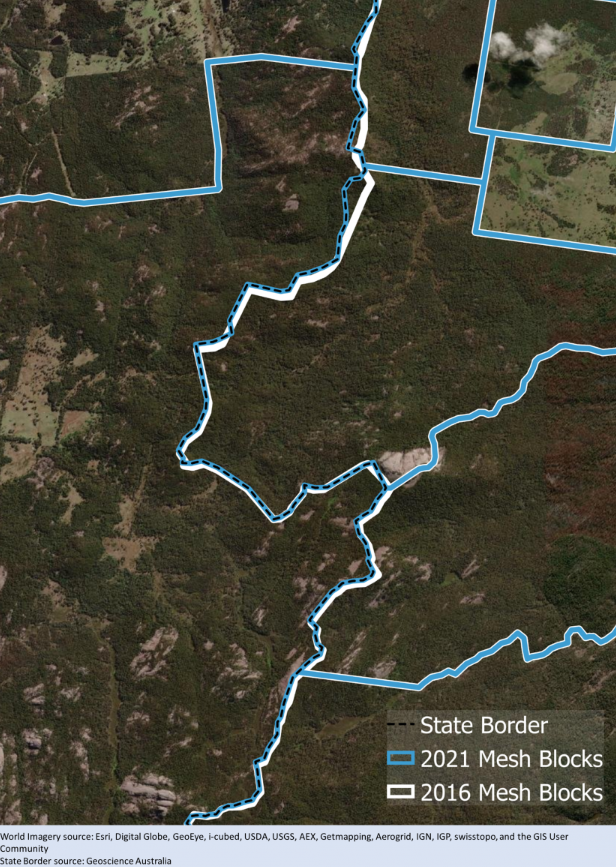
Mesh Block boundary files can be downloaded from authoritative sources, such as the Australian Bureau of Statistics (ABS) or relevant statistical agencies.
For ease, The Proptech Cloud has a free comprehensive dataset Geography – Boundaries & Insights – Australia ready for access and immediate use.
Geography – Boundaries & Insights – Australia
This free dataset from The Proptech Cloud is available for seamless access from Snowflake Marketplace.
Step 3: Geospatial Data Processing
Use Geographic Information System (GIS) software or programming libraries (e.g., Python with geospatial libraries like GeoPandas) to process and manipulate the mesh block boundaries.
Tip:
Geographical boundaries can be imported using Python libraries including Geopandas and shapely.
Many data warehouses including Snowflake, BigQuery and PostgreSQL have in-built geospatial functionality to allow for the processing of geospatial data.
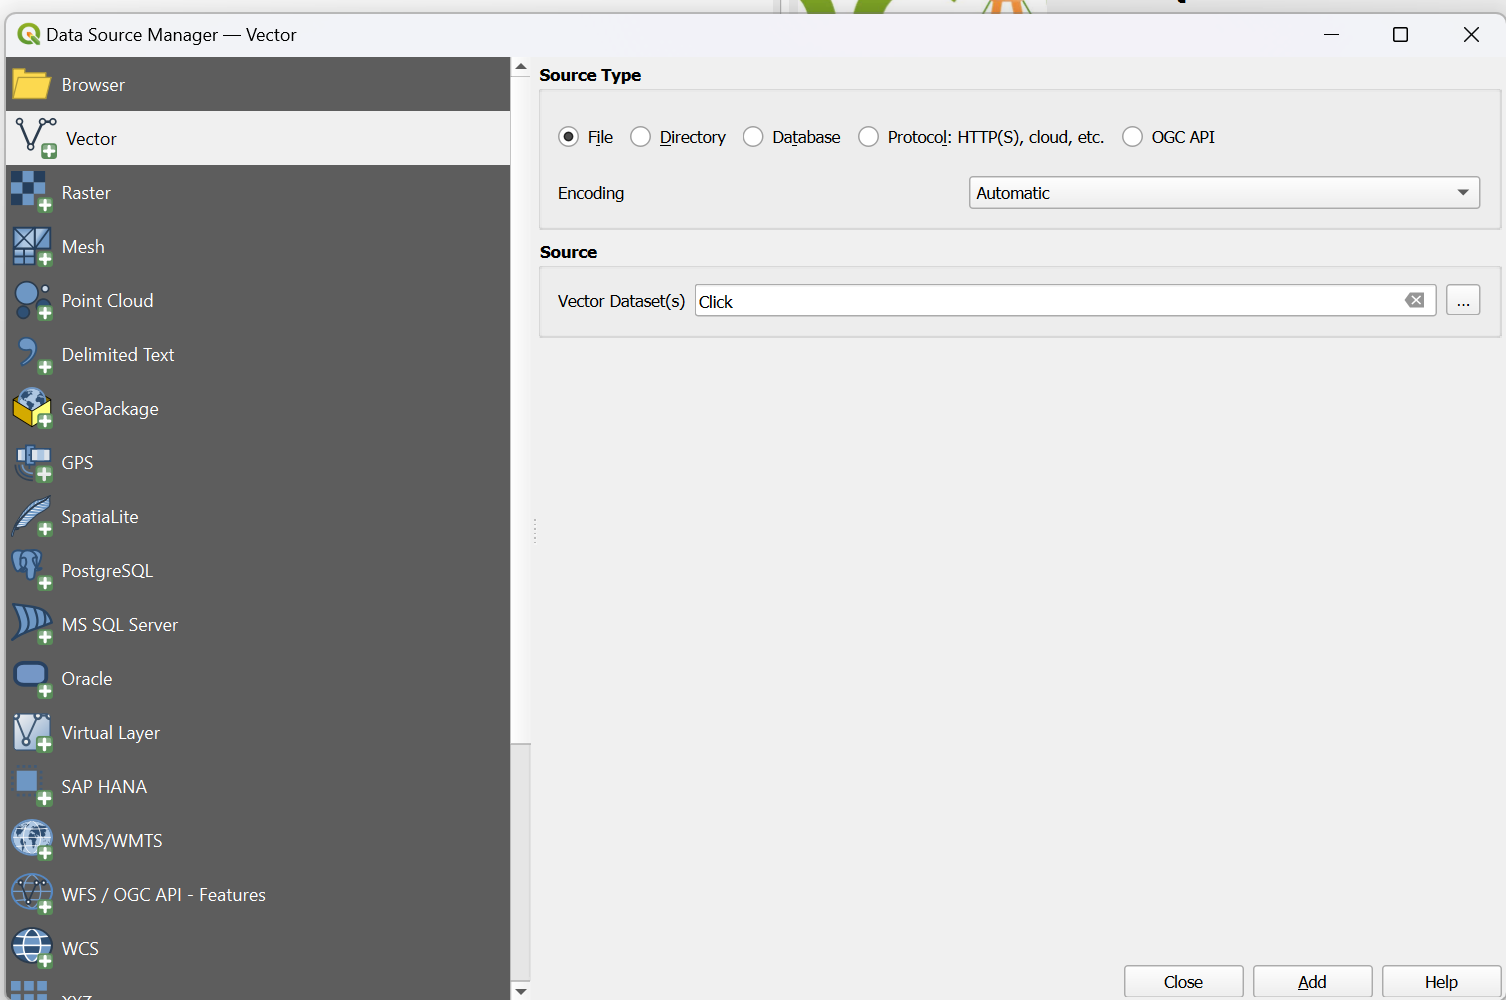
QGIS – Loading in Geospatial files in QGIS
1. From the toolbar at the top of the page click Layer > Add Layer > Add Vector Layer
2. Make sure the Source Type is clicked to File
3. Load in the Source Data by using the three dots button at the side of the Vector Dataset(s) toolbar
Geospatial Formats
The two most common ways geospatial data are represented in files are Well-Known-Text (WKT) which is a textual representation of a polygon and the geojson format which shows the coordinates and type of geojson format.
Both Python and Snowflake have capabilities to work with these 3 formats and parse them so they can be used in geography functions
WKT Format
#Example 2 using WKT format
from shapely import wkt
brisbane_bbox = “POLYGON ((153.012021 -27.471741, 153.012021 -27.462598, 153.032931 -27.462598, 153.032931 -27.471741, 153.012021 -27.471741))”
brisbane_poly = wkt.loads(brisbane_bbox)
Python – Loading in GeoJSON
The libraries geojson, shapely and json need to be installed.
#EXAMPLE 1 working with a geojson format
import json
import geojson
from shapely.geometry import shape
geojson_example = {
"coordinates": [[[153.01202116, -27.47174129], [153.01202116, -27.46259798], [153.03293092, -27.46259798], [153.03293092, -27.47174129], [153.01202116, -27.47174129]]],
"type": "Polygon"
}
geojson_json = json.dumps(geojson_example)
# Convert to geojson.geometry.Polygon
geojson_poly = geojson.loads(geojson_json)
poly = shape(geojson_poly ))
Snowflake
GeoJSON and WKT format can also be loaded into snowflake and converted to a geometry using the following commands:
#converting Well-Known-Text into geography formatSELECT ST_GEOGRAPHYFROMWKT('POLYGON ((153.012021 -27.471741, 153.012021 -27.462598, 153.032931 -27.462598, 153.032931 -27.471741, 153.012021 -27.471741))');
#Converting Geojson to geography format
SELECT TO_GEOGRAPHY('{
"coordinates": [[[153.01202116, -27.47174129], [153.01202116, -27.46259798], [153.03293092, -27.46259798], [153.03293092, -27.47174129], [153.01202116, -27.47174129]]],
"type": "Polygon"
}
')
Step 4: Data Matching
Match the dataset records with the appropriate mesh blocks based on their geographical coordinates. This involves linking each data point to the corresponding mesh block within which it is located.
Tip:
Geospatial functions which are supported in big data warehouses and Python can be used to match geospatial data.
A common way to match two geographical objects is to see if the coordinates of the two objects intersect. An example of how to do this in Python and Snowflake is shown below.
In Python
Data matching can be done using the shapely library intersects function.
from shapely import wkt, intersectsshape1 = wkt.loads("POLYGON ((153.012021 -27.471741, 153.012021 -27.462598, 153.032931 -27.462598, 153.032931 -27.471741, 153.012021 -27.471741))")
shape2 = wkt.loads("POLYGON ((153.012021 -27.471741, 153.032931 -27.462598, 153.012021 -27.471741))")
shape_int = intersects(shape1, shape2)
print(shape_int)
In Snowflake
Data matching can be done using the ST_Intersects function. One of the advantages of using big data warehouses including Snowflake to geospatially match data is that it leverages its highly scalable infrastructure to quickly complete geospatial processing.
WITH geog_1 as (SELECT ST_GEOGRAPHYFROMWKT('POLYGON ((153.012021 -27.471741, 153.012021 -27.462598, 153.032931 -27.462598, 153.032931 -27.471741, 153.012021 -27.471741))') as poly
),
geog_2 as (
SELECT ST_GEOGRAPHYFROMWKT('POLYGON ((153.012021 -27.471741, 153.022021 -27.465, 153.032931 -27.462598, 153.012021 -27.471741))') as poly
)
SELECT
g1.poly, g2.poly
FROM geog_1 as g1
INNER JOIN geog_2 as g2
on ST_INTERSECTS(g1.poly, g2.poly)
Step 5: Attribute Joining
If your dataset and mesh blocks data have common attributes (e.g., unique identifiers), perform attribute joins to combine information from both datasets. This allows you to enrich your dataset with additional details associated with mesh blocks.
Step 6: Quality Assurance
Verify the accuracy of the spatial integration by checking for any discrepancies or errors. Ensure that each data point is correctly associated with the corresponding mesh block.
Tip:
geojson.io is a handy website that can help with visualising geojson data and ensure it is correct.
If you’re using Snowflake, the ST_AsGeojson command can be used to convert geography into a geojson which allows you to quickly visualise the shapes created.
Step 7: Data Analysis and Visualisation
Leverage the integrated dataset for analysis and visualisation. Explore trends, patterns, and relationships within the data at the mesh block level. Utilise geospatial tools to create maps and visual representations of the information.
Tip:
It’s worth mentioning that Snowflake has the option to create a Streamlit app within the Snowflake UI which allows for the cleaning and processing of data using Python and SQL and the interactive visualisation of data through the Streamlit App.
Snowflake also integrates really well with local Python development environments so all the initial data processing and cleaning can be done through a Snowflake API, then geography can be converted to a GeoJson or Text formal. Thereafter, libraries like plotly, folium, pydeck can be used to do complex geospatial visualisations.
Step 8: Data Storage and Management
Establish a system for storing and managing the integrated dataset, ensuring that it remains up-to-date as new data becomes available.
Consider using databases or platforms that support geospatial data.
Tip:
Geospatial datasets are usually very large and complex datasets due to the number of attributes included in a geospatial dataset, the resolution of the data and the number of records.
Cloud-based big data platforms can be an excellent option for storing geospatial data due to the low-cost of storage. Many of these platforms including also have spatial clustering options so that geospatial data in a similar location are grouped together, meaning queries for data in certain areas run more efficiently.
Snowflake (Enterprise Edition or Higher) also has an option to add a search optimisation to geospatial data tables to optimise the performance of queries that use geospatial functions.
Step 9: Documentation
Document the integration process, including the source of mesh block boundaries, any transformations applied, and the methods used for data matching. This documentation is essential for transparency and replicability.
By following these above steps, you can effectively incorporate mesh blocks into your datasets, enabling a more detailed and location-specific analysis of the information at the mesh block level.
Geography – Boundaries & Insights – Australia
This free dataset from The Proptech Cloud is available for seamless access from Snowflake Marketplace.
The intellectual property rights for all content in this blog are exclusively held by Data Army and The Proptech Cloud. All rights are reserved, and no content may be republished or reproduced without express written permission from us. All content provided is for informational purposes only. While we strive to ensure that the information provided here is both factual and accurate, we make no representations or warranties of any kind about the completeness, accuracy, reliability, suitability, or availability with respect to the blog or the information, products, services, or related graphics contained on the blog for any purpose.
Subscribe to our newsletter
Subscribe to receive the latest blogs and data listings direct to your inbox.

