Crafting a Storm Surge and Hurricane Risk Rating for Coastal Properties

Crafting a Storm Surge and Hurricane Risk Rating for Coastal Properties

In an era where climate change is intensifying the frequency and severity of storms and hurricanes, especially in coastal regions, understanding and quantifying the associated risks is critical.

According to the National Geographic Society, a storm surge is a rise in sea level that occurs during tropical cyclones, which are intense storms also known as typhoons or hurricanes.

The storms produce strong winds that push the water into shore which can lead to flooding and pose a real threat in coastal regions.

To help understand these risks, a Storm Surge and Hurricane Risk Rating score can provide property owners, developers, real estate agents, insurers, urban planners, local governments, buyers and investors with a clear picture of a property’s vulnerability to these natural disasters.

These stakeholders will be conducting their own necessary research, and a risk rating system can offer an indicative metric to guide their decisions.

Why is a Storm Surge and Hurricane Risk Rating Important?

Understanding storm surge and hurricane risks is crucial for building a resilient society.

Natural catastrophes pose significant challenges, and quantifying these risks can aid in better preparation and prompt responses.

Strengthening homes and incentivising homeowners to invest in property fortification can reduce potential losses. Accurate risk assessments and reliable data can allow insurers to offer discounts for mitigation actions, enhance home resale values, and reveal the increased costs to mortgage issuers due to natural disasters.

Achieving resilience relies on expert understanding of the real estate ecosystem and the benefits of informed mitigation strategies.

Steps to build a Storm Surge and Hurricane Risk Rating

1. Defining scoring criteria and scale

The foundation of a risk rating system is a clear and understandable scale, such as 1 to 10, with each number representing a different level of risk.

Establishing specific criteria for assessment is also essential for a well-rounded evaluation.

2. Key factors to consider

Several factors contribute significantly to a property’s risk from storm surges and hurricanes:
Proximity to coast


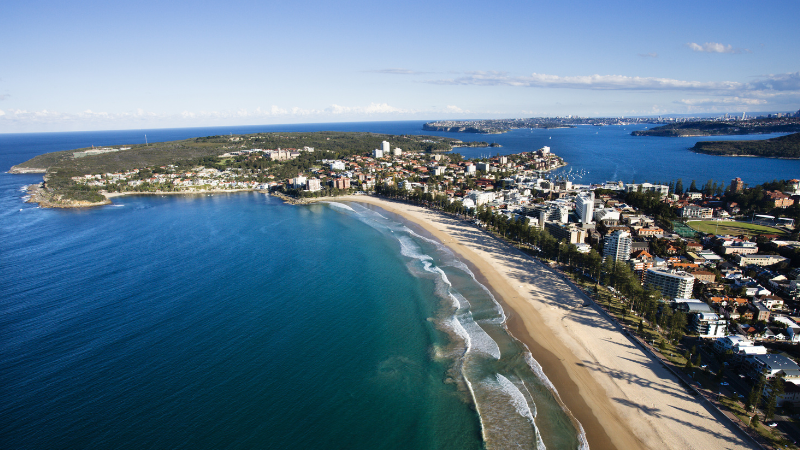
  • Proximity to Coastline: The closer a property is to the coastline, the higher the risk of storm surge impacts.
  • Elevation and Topography: Properties at higher elevations or with certain topographical features may have reduced risk.
  • Historical Data: Analysing past hurricane and storm surge incidents from historical weather databases and local government records can provide critical insights into potential future risks.
  • Local Climate Trends: Understanding the local weather patterns can help predict the likelihood of storms.
Natural barriers
  • Flood Zone Designation: Properties in designated flood zones face a heightened risk. Flood risk information is generally available from Local Councils.
  • Building Design and Materials: Construction that is designed to be resilient against high winds and flooding can mitigate risk.
  • Infrastructure and Preparedness: Robust local infrastructure and emergency plans can play a vital role in risk reduction.
  • Natural Barriers: The presence of natural features, such as dunes or wetlands that can absorb storm impacts, reduces risk.
  • Regional Planning: Effective community and regional planning and zoning can mitigate potential damage. Consult local zoning laws and development plans for more property-specific.

3. Assigning weights to each factor

Assigning appropriate weights to each of the above factors based on its impact on overall risk ensures that the score accurately reflects the property’s vulnerability.

Use expert consultations and statistical analysis to determine appropriate weights, and adjust weights based on real-world data and expert feedback.

4. Data collection and analysis

Gathering and analysing data, including GIS mapping, climate records and historical event data, is crucial to assigning accurate sub-scores for each criterion. Cross-referencing multiple sources will ensure data accuracy and statistical software can be used for thorough analysis.

5. Calculating the overall score

By aggregating these sub-scores, considering their respective weights, we arrive at a comprehensive risk rating for each property. Using a formula or algorithm will ensure consistency in calculations. Further validating the scoring system with sample properties will help improve accuracy.

6. Validation and adjustment

It’s vital to validate and adjust the rating system against historical data and expert analysis to ensure its reliability and accuracy. Regularly review and update the criteria and weights based on new data.

Checklist

7. Providing risk mitigation recommendations

Along with the risk score, offering advice on how to reduce a property’s vulnerability to storm surges and hurricanes can be highly beneficial. Suggestions such as upgrading building materials, improving drainage systems or investing in flood barriers can form a checklist of actionable steps to reduce a property’s vulnerability.

8. Regular updates and re-evaluations

Continuously updating the risk rating system to reflect environmental changes, infrastructure developments and updated data is crucial. This includes regular reviews, incorporating new data and tech advancements can improve the risk rating system. 

Building Resilience with Accurate Risk Ratings

Stakeholders can create a robust and reliable risk rating system that enhances safety and preparedness in coastal areas.

A well-developed Storm Surge and Hurricane Risk Rating can provide essential information for making educated decisions about property development, insurance and risk management.

As the world grapples with the increasing challenges of climate change, these tools become ever more critical in our collective efforts to build resilient communities.

Subscribe to our newsletter

Subscribe to receive the latest blogs and data listings direct to your inbox.

Read more blogs from The Proptech Cloud

Crafting a Storm Surge and Hurricane Risk Rating for Coastal Properties

A high-level approach to developing a storm surge and hurricane risk rating system to guide stakeholders with a vested interest in coastal properties.

How Proptech Is Revolutionising Real Estate

Proptech is the dynamic intersection of property and technology, and it’s reshaping real estate. And there’s still a huge potential for growth.

What is the Australian Statistical Geography Standard (ASGS)?

The ASGS is used to better understand where people live and how communities are formed.

How to Incorporate Mesh Blocks into Datasets

Mesh blocks can enhance the precision and relevance of geospatial and proptech analyses. Here are some tips and steps to incorporate mesh blocks into datasets.

Australia’s Migration Trends: Where Are People Moving To?

This detailed visual analysis for Australia’s major capital cities breaks down how net migration trends are evolving across different regions.

How Proptech Is Revolutionising Real Estate

How Proptech Is Revolutionising Real Estate

Real estate, the world’s largest asset class, valued at a staggering $7.56 trillion, has long been a sleeping giant when it comes to technological innovation. But now, it’s waking up. Recent years have witnessed an unprecedented surge in proptech.

What is Proptech?

PropTech is short for Property Technology which, as its name suggests, is the dynamic intersection of property and technology.

Broadly, it refers to the innovative use of technology in the real estate industry and covers a wide range of tech solutions and innovations aimed at disrupting and digitising various aspects of the real estate sector, including property management, leasing, sales, construction, investment and others.

Proptech tackles key issues in how we use and benefit from real estate. It’s already streamlining processes and transactions, creating new opportunities, addressing pain points, cutting costs, enhancing connectivity, productivity and boosting convenience for residents, owners, landlords and other stakeholders.

Why the Surge in Proptech?

Several key factors have contributed to the rapid rise of proptech. The COVID-19 pandemic significantly accelerated the need for virtual, no-touch experiences, driving technological innovation across the sector.

Technological advancements with practical applications in real estate have also played a crucial role. Examples of innovations include:

  • Virtual Reality (VR) and Augmented Reality (AR) enhancing property viewing experiences.
  • Artificial Intelligence (AI) and Machine Learning (ML) providing data-driven insights and personalised recommendations.
  • Internet of Things (IoT) enabling smart home features and efficient property management.
  • Blockchain Technology allowing fractional property ownership, offering new ways for buyers and sellers to connect and potentially cutting costs by removing intermediaries out of the transaction process.
  • Drone Technology offering virtual tours and aerial views,

Increased connectivity and the availability of real estate data, have improved customer experiences and enabled faster, more informed decisions in real estate transactions, planning and development.

Regulatory changes have also revolutionised the way real estate operates.

Regulatory changes serve as a catalyst for proptech innovation. By creating new challenges and setting higher standards, regulations drive the development of advanced technologies and solutions that help businesses comply, operate more efficiently, and enhance their services. This continuous push for innovation ensures that the real estate industry evolves to meet modern demands.

The pressing issue of housing affordability has spurred creative approaches to real estate ownership and investment too. Proptech and financial technology (fintech) are democratising property investment, making it more accessible through crowdfunding platforms, fractional ownership, and Real Estate Investment Trusts (REITs).

The potential for disruption and innovation in the real estate sector has attracted significant investor interest. Corporate venture capital units and accelerator programs further support and fast-track proptech startup funding.

Proptech’s Potential to Reimagine Real Estate

Proptech has gained significant traction in recent years as real estate professionals and investors recognise the potential of technology to disrupt.

According to PropTechBuzz, hundreds of Australian proptech startups are leveraging the power of advanced technologies like big data, AI, AR and generating over $1.4 billion of direct economic output.

Yet, we are only on the cusp of proptech’s true potential.

Signs show that this fledgling industry has yet to reach its pinnacle.

A recent Deloitte survey Global Real Estate Outlook Survey of real estate owners and investors across North America, Europe, and Asia/Pacific reveals:

  • Many real estate firms address years of amassed technical debt by ramping up technology capabilities. 59% of respondents say they do not have the data, processes, and internal controls necessary to comply with these regulations and expect it will take significant effort to reach compliance.
  • Many real estate firms aren’t ready to meet environmental, social, and governance (ESG) regulations. 61% admit their firms’ core technology infrastructures still rely on legacy systems. However, nearly half are making efforts to modernise.

Barriers to progress still exist.

A survey of 216 Australian property companies from 2021 by the Property Council of Australia and Yardi Systems show that

  • There is the perception that solutions must be specially developed or customised (34%).
  • 26% of respondents see changing existing behaviours as the biggest obstacle to overcome, followed by cost (23%) and time constraints (11%).

The Future of Proptech

The future of proptech is looking bright.

As new technology, trends, and other contributing factors converge to accelerate innovation in the real estate (and its neighbouring) sectors, new ideas take flight and promise to disrupt traditional processes.

Proptech brings exciting benefits, boosting the real estate industry’s digital presence, productivity and enhancing experiences for everyone involved.

It fosters innovation and automation, adding convenience, efficiency, transparency and accuracy to administrative and operational tasks.

Additionally, proptech holds the promise of better access to data and analytics and the integration of sustainability practices.

As technology continues to advance and consumer preferences evolve, proptech is likely to play an increasingly prominent role in shaping the future of the real estate industry.

Proptech revolutionising real estate

Subscribe to our newsletter

Subscribe to receive the latest blogs and data listings direct to your inbox.

Read more blogs from The Proptech Cloud

Crafting a Storm Surge and Hurricane Risk Rating for Coastal Properties

A high-level approach to developing a storm surge and hurricane risk rating system to guide stakeholders with a vested interest in coastal properties.

How Proptech Is Revolutionising Real Estate

Proptech is the dynamic intersection of property and technology, and it’s reshaping real estate. And there’s still a huge potential for growth.

What is the Australian Statistical Geography Standard (ASGS)?

The ASGS is used to better understand where people live and how communities are formed.

How to Incorporate Mesh Blocks into Datasets

Mesh blocks can enhance the precision and relevance of geospatial and proptech analyses. Here are some tips and steps to incorporate mesh blocks into datasets.

Australia’s Migration Trends: Where Are People Moving To?

This detailed visual analysis for Australia’s major capital cities breaks down how net migration trends are evolving across different regions.

What is the Australian Statistical Geography Standard (ASGS)?

What is the Australian Statistical Geography Standard (ASGS)?

What is the Australian Statistical Geography Standard (ASGS)?

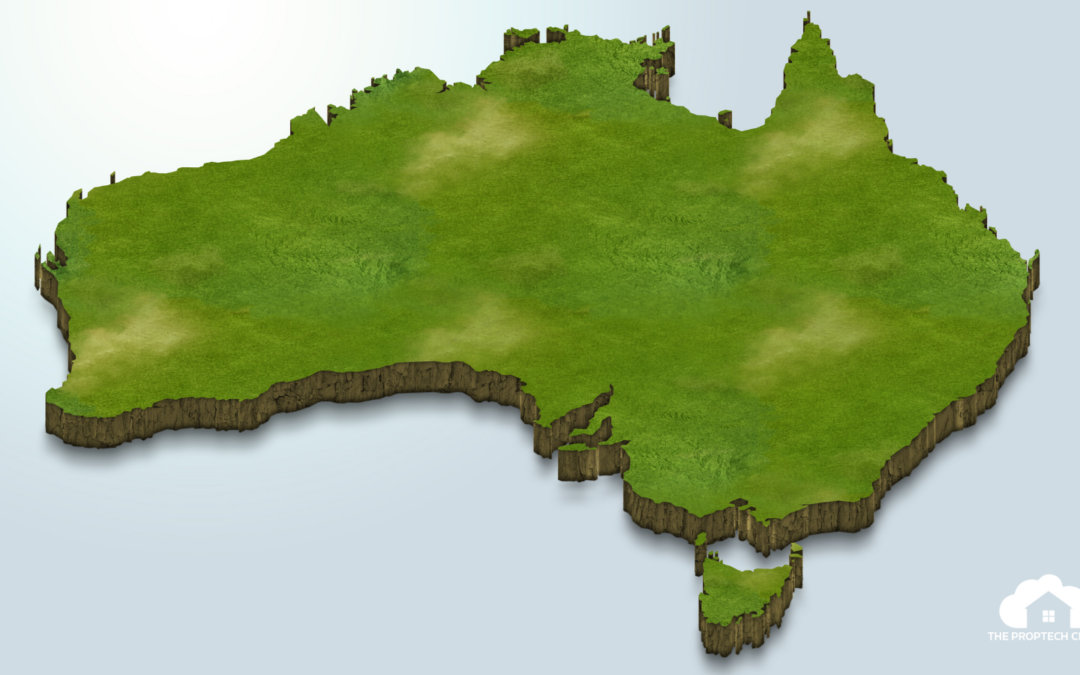
The Australian Statistical Geography Standard (ASGS) is essentially a framework used to classify and organise geographical areas across Australia for the purpose of collecting, analysing, and disseminating statistics.

Mesh Block Changes

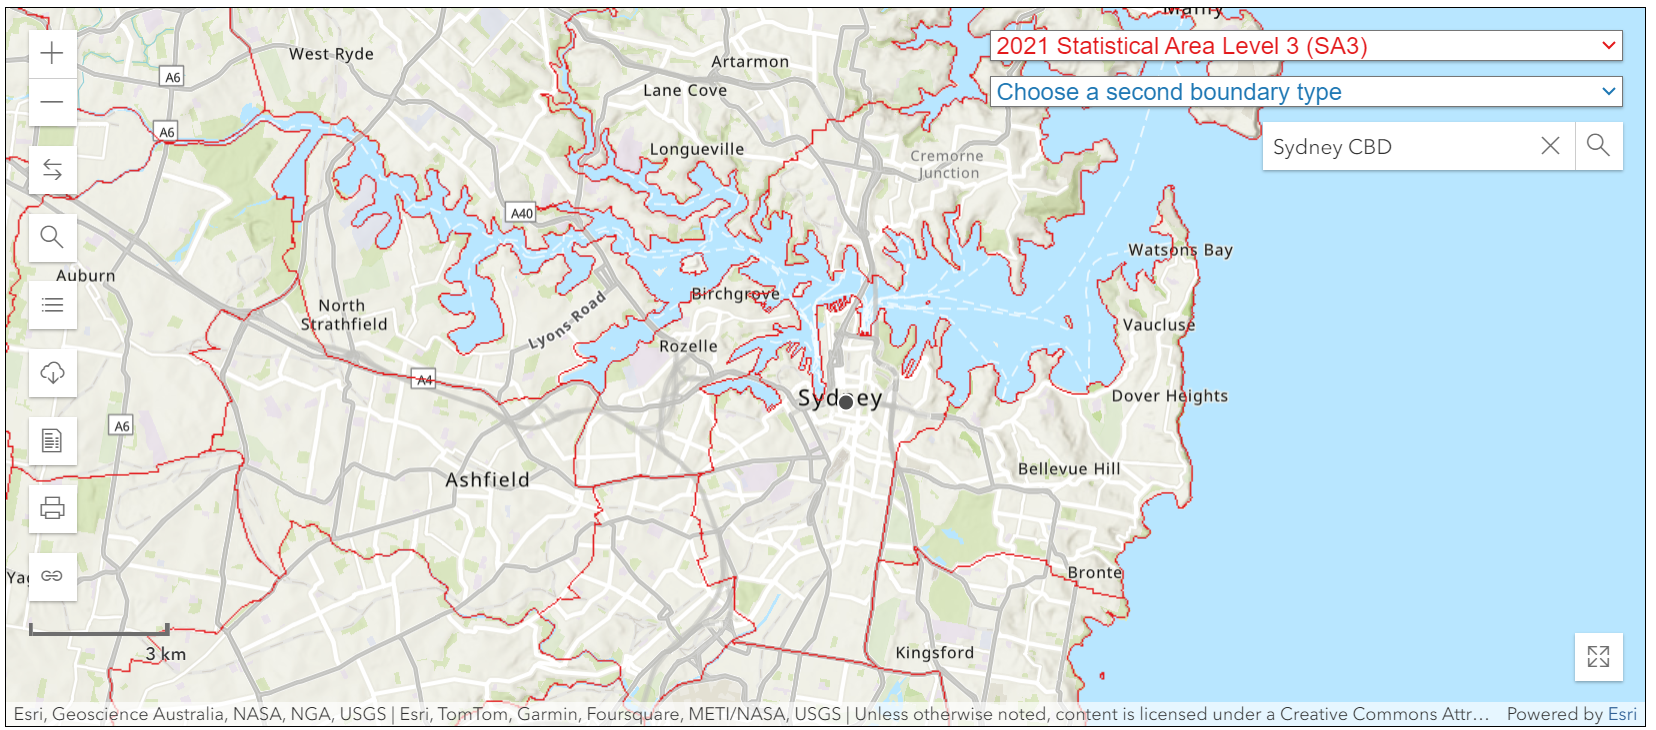
Edition 3 ASGS 2021 – Sydney Statistical Area 3 (SA3)
Source: ABS Maps

By organising Australia into a system of statistical areas, the ASGS can be used to perform standardised location-based analysis on things that matter to your business. For example, where your customers live or shop, where your competitors operate, where you have business assets located or where weather patterns are observed.

The ASGS is a detailed way of representing Australia’s geographical diversity in statistical data.

By dividing the country into hierarchical levels of statistical areas, ranging from broad regions to specific localities, it allows accurate and meaningful analysis of various data, including population, economic and environmental statistics – ultimately, to better understand where people live and how communities are formed.

The ASGS was introduced in 2011 to replace the previous Australian Standard Geographical Classification (ASGC).

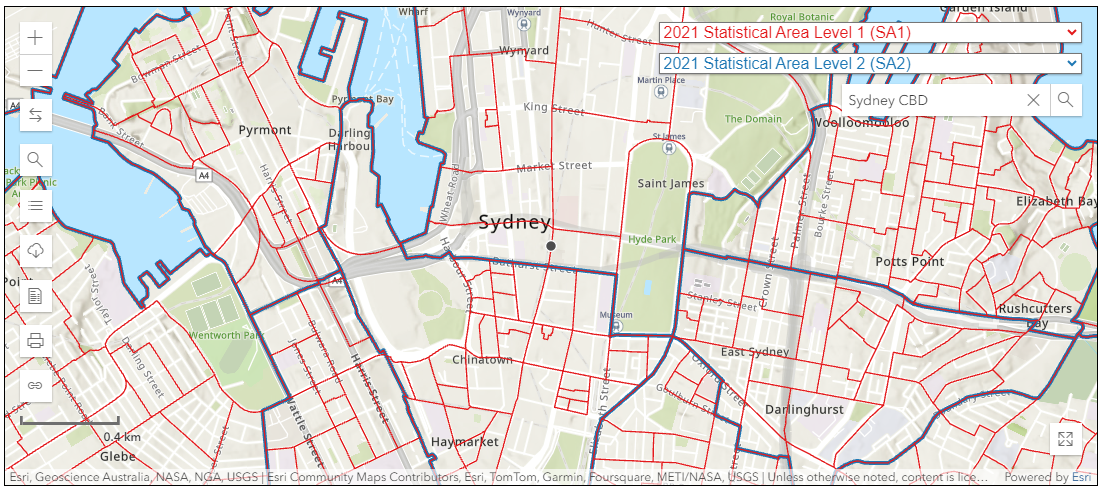
Sydney CBD SA1 & SA2

Edition 3 ASGS 2021 – Sydney Central Business District (CBD) Statistical Area 1 (SA1) and Statistical Area 2 (SA2).
Source: ABS Maps

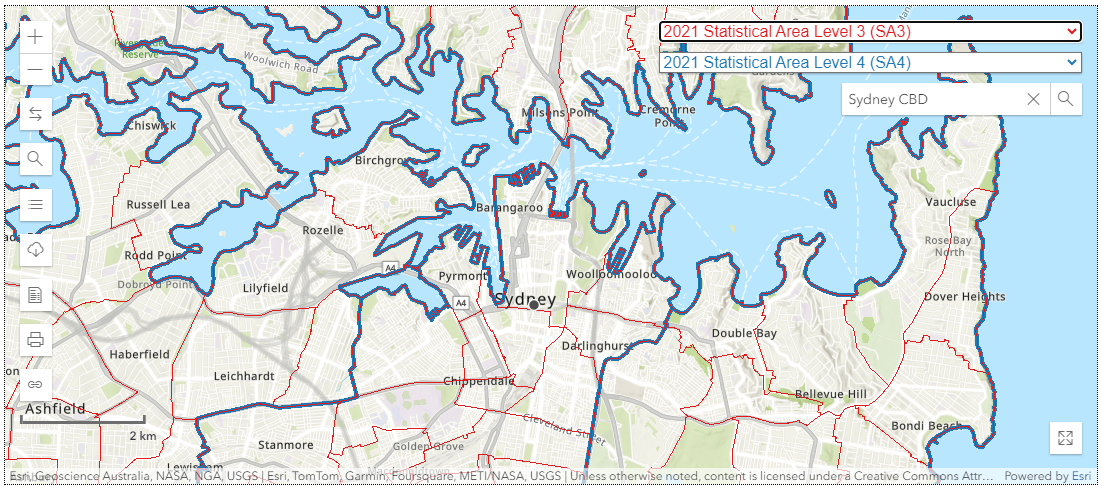
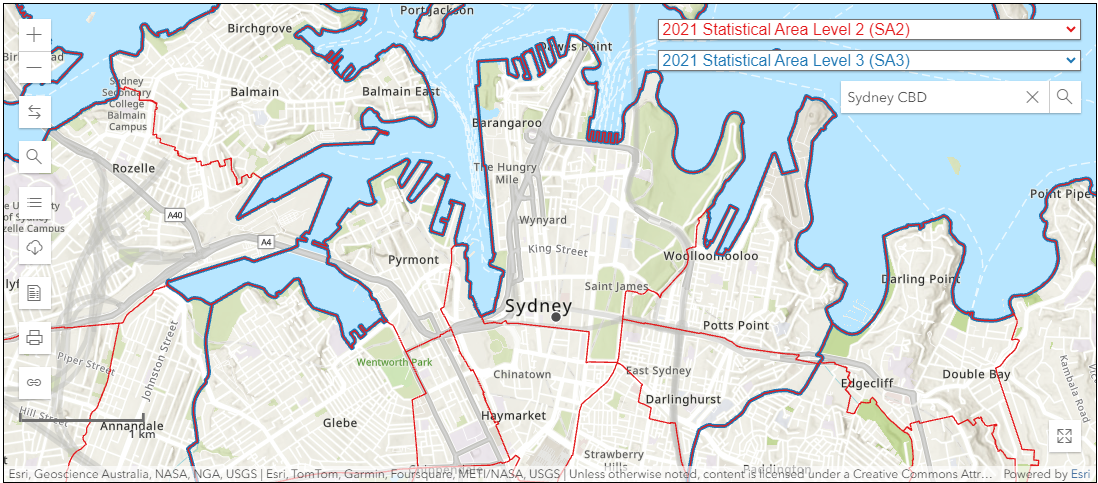
Sydney CBD SA2 & SA3

Edition 3 ASGS 2021 – Sydney CBD Statistical Area 2 (SA2) and Statistical Area 3 (SA3).
Source: ABS Maps

Sydney CBD SA3 & SA4

Edition 3 ASGS 2021 – Sydney CBD Statistical Area 3 (SA3) and Statistical Area 4 (SA4).
Source: ABS Maps

Updates of the Australian Statistical Geography Standard (ASGS)

The ASGS is revised and refreshed every five years to reflect changes in the population, demographics, the country’s development and geographic boundaries to ensure it remains relevant and useful for statistical purposes.

The third edition, linked to the 2021 Census, began rolling out in July 2021 and includes updates to various geographic categorisations, ending with the Remoteness Structure in March 2023.

The Australian Bureau of Statistics (ABS) oversees the ASGS and reviews it to ensure it meets current needs, incorporating feedback from public consultation. Additionally, they offer the online tool, ABS Maps, for exploring and comparing these statistical areas.

ASGS Edition 3 hierarchy of statistical areas

The Australian Statistical Geography Standard (ASGS) is represented through a hierarchical framework of statistical areas. 

The ASGS is split into ABS and non ABS Structures. Of these, ABS Structures are geographies designed by the ABS for the purposes of releasing and the analysis of statistics.

The hierarchy is made up of several nested levels, which enables a flexible and consistent approach to understanding and managing geographic data. 

Here is the ASGS Edition 3 Structures as published by the Australian Bureau of Statistics:


Main Structure and Greater Capital City Statistical Areas

  • Mesh Blocks: The smallest geographic unit, designed to cover all of Australia without gaps or overlaps. Mesh Blocks are the building blocks for larger statistical areas. Read more about Mesh Blocks>
  • Statistical Areas Level 1 (SA1): Groups of Mesh Blocks with populations between 200 and 800 people. They are used in the Census of Population and Housing.
  • Statistical Areas Level 2 (SA2): Aggregates of SA1s, generally with populations between 3,000 and 25,000 people. They represent functional areas that interact socially and economically.
  • Statistical Areas Level 3 (SA3): Groups of SA2s, reflecting regional cities and large urban transport hubs.
  • Statistical Areas Level 4 (SA4): Aggregates of SA3s, representing labour markets or regions with similar socioeconomic characteristics.
  • Greater Capital City Statistical Areas (GCCSA): Represent each of the eight state and territory capital cities.

Special Purpose Regions

Indigenous Structure

  • Indigenous Regions and Areas: Defined to facilitate the statistical analysis of the distribution of Aboriginal and Torres Strait Islander populations. The three hierarchical levels are: Indigenous Locations, Indigenous Areas and Indigenous Regions.

Remoteness Structure

  • Remoteness Areas: Classify areas based on their remoteness from services and population centres. The five remoteness classes are: Major Cities, Inner Regional, Outer Regional, Remote and Very Remote.

Significant Urban Areas, Section of State, Urban Centres and Localities

  • Urban Centres and Localities (UCLs): Define urban and rural areas based on population size and density.
  • Section of State (SOS): SOS groups the UCLs into classes of urban areas based on population size.

  • Classifying urban areas in several different ways is to allow statistical data to be made available to Australian towns and cities and for statistical analysis.

Non ABS Structures

  • Non ABS Structures: These are administrative regions that are not defined or maintained by the ABS. They include eight geographies: Local Government Areas, State Electoral Divisions, Commonwealth Electoral Divisions, Destination Zones, Postal Areas, Suburbs and Localities, Australian Drainage Divisions and Tourism Regions.

What tools can be used for representing and analysing ASGS?

These tools collectively offer a comprehensive approach to representing and analysing ASGS data.

They provide the necessary geographic context and detailed spatial data required for thorough analysis.

A combination of these resources can enable data professionals to enhance their analytical capabilities and produce insightful visualisations to support planning and informed decision making.


  • ABS Maps: An online tool provided by the Australian Bureau of Statistics (ABS) that allows users to explore and compare different statistical areas defined by the ASGS.
  • Geographic Information System (GIS) Files: GIS is a framework for gathering, managing, and analysing spatial and geographic data, encompassing a broad range of tools and functionalities. GIS files (formats may include shapefiles, GeoJSON, and KMLare) available for download, allowing for detailed spatial analysis using software like ArcGIS or QGIS.
  • Online Data Portals: Platforms such as the ABS Data Explorer or Australian National Map provide access to a variety of geographic data layers. This allows users to visualise and download data in different formats for analysis.
  • Statistical and Data Visualisation Software: R, Python (with libraries like Geopandas and Folium), and Tableau can be used to import ASGS data for advanced statistical analysis and visualisation, enabling the creation of custom maps and visual representations of the data.
  • Spatial Databases: Databases such as PostGIS that are optimised for storing and querying spatial data and facilitates efficient management and analysis of large geographic datasets.
  • Printed Maps and Documentation: Detailed maps and explanatory notes published by the ABS, outlining the boundaries and characteristics of each statistical area.
Analysis

What is the ASGS used for?

One of ASGS’s primary uses is for the Census, the study of Australia’s population.

The ASGS is integral to Australia’s Census as it defines geographic boundaries, facilitates detailed data collection and enumeration, enables comprehensive data analysis and reporting, and supports informed decision-making, resource allocation, policy making and planning by government agencies.

However it is also used broadly by the Australian Bureau of Statistics (ABS) and other entities.

The ASGS is versatile enough to support a wide array of activities involving the accurate collection of geographic and statistical data across Australia, making it a fundamental element in analysis.


  • Detailed demographics: The ASGS allows businesses to segment customers based on detailed geographic and demographic data. By using Statistical Areas (SA1 to SA4), companies can identify distinct customer groups within specific regions, tailoring marketing strategies and product offerings to the unique characteristics of each segment.
  • Targeted marketing: Businesses can use Mesh Blocks or SA1 regions to create hyper-local marketing campaigns, ensuring that promotional efforts are targeted towards areas with the highest potential for engagement and conversion.
  • Real estate and urban planning: The ASGS provides a robust framework for organising geographic areas to satisfy a broad range of uses in real estate. It can be used to enhance analysis of localities for a better understanding of local demographic through to reporting of property-related data. Examples include: analysis of housing trends, planning of urban developments, identifying growth areas or conducting property valuations with a clear understanding of geographic distinctions.
  • Accurate market data aggregation: The hierarchical structure of the ASGS enables businesses to aggregate and report market data accurately across various geographic levels, from local neighborhoods (SA1) to larger regions (SA4). This helps in understanding market trends and consumer behavior across different areas.
  • Market trend analysis: By comparing data across different Census periods using consistent ASGS boundaries, businesses can track market trends and demographic shifts, aiding in long-term strategic planning and investment decisions.
  • Business and market analysis: Companies leverage the ASGS for market analysis, site selection and strategic planning as it can help businesses understand demographic trends and geographical distributions of markets to inform targeted marketing and business expansion strategies.
  • Retail demand forecasting: Retailers can use ASGS data to forecast demand for products in different geographic areas. By understanding population density, age distribution, and income levels within mesh blocks or SA2 areas, businesses can optimise inventory levels to match local demand.
  • Supply chain efficiency: The ASGS framework helps retailers plan efficient distribution routes and manage stock levels more effectively, ensuring that products are available where they are needed most without overstocking or stockouts.
  • Competitor analysis: Businesses can use ASGS-defined regions to map out the geographic locations of competitors, analysing their market coverage and identifying potential gaps or opportunities for expansion.
  • Market share estimation: By integrating ASGS data with sales and demographic information, companies can estimate market share within specific regions, helping to assess competitive strengths and weaknesses.
  • Environmental risk assessment: The ASGS allows for precise mapping of environmental risks such as flood zones, bushfire-prone areas, and pollution levels. By overlaying environmental data with population and infrastructure data from the ASGS, businesses can assess the potential impact of environmental risks on their operations.
  • Environmental regulation compliance and planning: Companies can use ASGS data to ensure compliance with environmental regulations and to plan mitigation strategies for at-risk areas. This helps in safeguarding assets and maintaining operational continuity.
  • Research and academia: Researchers and academics use the ASGS for conducting spatial analysis and regional studies, allowing detailed investigations into socio-economic, environmental, and demographic conditions across different regions.

The essential role of ASGS

The Australian Statistical Geography Standard (ASGS) plays a foundational role in statistical geography, allowing users to analyse and visualise statistics based on location. Its extensive applications, regular updates, and strong endorsement by the ABS ensure its implementation and integrity.

As such, the ASGS remains an essential framework and a mainstay in Australian geographic and statistical analysis—an indispensable tool for ensuring the accuracy, consistency, and relevance of geographic data across various domains.

How to Incorporate Mesh Blocks into Datasets

Incorporating mesh blocks into datasets involves several steps to ensure seamless integration and effective utilisation of geographical information. Here’s a guide on how to incorporate mesh blocks into datasets.

Subscribe to our newsletter

Subscribe to receive the latest blogs and data listings direct to your inbox.

Read more blogs from The Proptech Cloud

Crafting a Storm Surge and Hurricane Risk Rating for Coastal Properties

A high-level approach to developing a storm surge and hurricane risk rating system to guide stakeholders with a vested interest in coastal properties.

How Proptech Is Revolutionising Real Estate

Proptech is the dynamic intersection of property and technology, and it’s reshaping real estate. And there’s still a huge potential for growth.

What is the Australian Statistical Geography Standard (ASGS)?

The ASGS is used to better understand where people live and how communities are formed.

How to Incorporate Mesh Blocks into Datasets

Mesh blocks can enhance the precision and relevance of geospatial and proptech analyses. Here are some tips and steps to incorporate mesh blocks into datasets.

Australia’s Migration Trends: Where Are People Moving To?

This detailed visual analysis for Australia’s major capital cities breaks down how net migration trends are evolving across different regions.

How to Incorporate Mesh Blocks into Datasets

How to Incorporate Mesh Blocks into Datasets

Mesh Blocks in real estate and proptech applications

Mesh Blocks are useful for geospatial and proptech applications, providing granularity and accuracy for understanding local real estate markets, demographics and land use.

The integration of Mesh Blocks into datasets can enhance the precision and relevance of analyses within the proptech and real estate sectors.

Useful in geospatial data and census analyses, embedding Mesh Blocks into digital boundaries enhances their usability in various applications.

We will cover the steps to incorporate mesh blocks into data sets below.

What are Mesh Blocks and how are they used in real estate?

Mesh Blocks are foundational building blocks for geospatial and proptech applications, providing granularity and accuracy for understanding local real estate markets, demographics and land use.

How to incorporate Mesh Blocks into datasets

Incorporating Mesh Block into datasets involves several steps to ensure seamless integration and effective utilisation of geographical information. Here’s a guide on how to incorporate Mesh Blocks into datasets:

Step 1: Data Collection

Gather relevant data that aligns with Mesh Blocks.

This may include demographic information, property values, land use details, or any other dataset that can be associated with specific geographical areas.


Step 2: Download Mesh Block Boundaries

Mesh Block boundary files can be downloaded from authoritative sources, such as the Australian Bureau of Statistics (ABS) or relevant statistical agencies.

For ease, The Proptech Cloud has a free comprehensive dataset Geography – Boundaries & Insights – Australia ready for access and immediate use.

Geography – Boundaries & Insights – Australia

This free dataset from The Proptech Cloud is available for seamless access from Snowflake Marketplace.

Step 3: Geospatial Data Processing

Use Geographic Information System (GIS) software or programming libraries (e.g., Python with geospatial libraries like GeoPandas) to process and manipulate the mesh block boundaries.

Tip:

Geographical boundaries can be imported using Python libraries including Geopandas and shapely.

Many data warehouses including Snowflake, BigQuery and PostgreSQL have in-built geospatial functionality to allow for the processing of geospatial data.

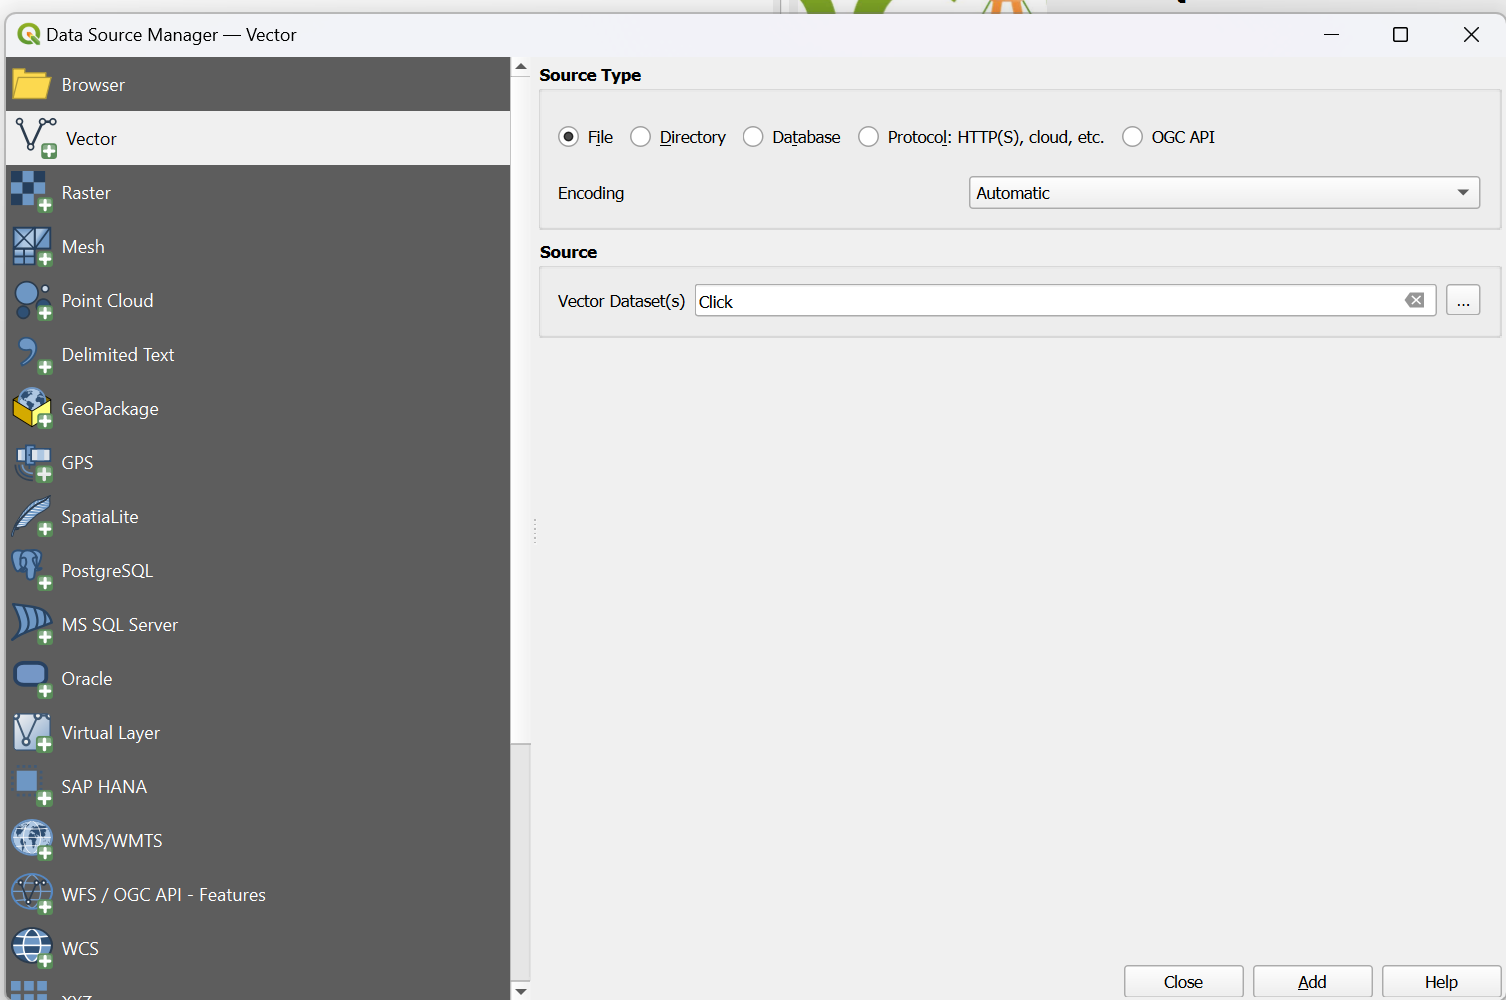
QGIS – Loading in Geospatial files in QGIS

1. From the toolbar at the top of the page click Layer > Add Layer > Add Vector Layer

2. Make sure the Source Type is clicked to File

3. Load in the Source Data by using the three dots button at the side of the Vector Dataset(s) toolbar

QGIS - Loading in Geospatial files in QGIS

Geospatial Formats

The two most common ways geospatial data are represented in files are Well-Known-Text (WKT) which is a textual representation of a polygon and the geojson format which shows the coordinates and type of geojson format.

Both Python and Snowflake have capabilities to work with these 3 formats and parse them so they can be used in geography functions

WKT Format

#Example 2 using WKT format

from shapely import wkt

brisbane_bbox = “POLYGON ((153.012021 -27.471741, 153.012021 -27.462598, 153.032931 -27.462598, 153.032931 -27.471741, 153.012021 -27.471741))”

brisbane_poly = wkt.loads(brisbane_bbox)

Python – Loading in GeoJSON

The libraries geojson, shapely and json need to be installed.

#EXAMPLE 1 working with a geojson format

import json

import geojson

from shapely.geometry import shape

geojson_example = {

"coordinates": [[[153.01202116, -27.47174129], [153.01202116, -27.46259798], [153.03293092, -27.46259798], [153.03293092, -27.47174129], [153.01202116, -27.47174129]]],

"type": "Polygon"

}

geojson_json = json.dumps(geojson_example)

# Convert to geojson.geometry.Polygon

geojson_poly = geojson.loads(geojson_json)

poly = shape(geojson_poly ))

Snowflake

GeoJSON and WKT format can also be loaded into snowflake and converted to a geometry using the following commands:

#converting Well-Known-Text into geography format

SELECT ST_GEOGRAPHYFROMWKT('POLYGON ((153.012021 -27.471741, 153.012021 -27.462598, 153.032931 -27.462598, 153.032931 -27.471741, 153.012021 -27.471741))');

#Converting Geojson to geography format

SELECT TO_GEOGRAPHY('{

"coordinates": [[[153.01202116, -27.47174129], [153.01202116, -27.46259798], [153.03293092, -27.46259798], [153.03293092, -27.47174129], [153.01202116, -27.47174129]]],

"type": "Polygon"

}

')

Step 4: Data Matching

Match the dataset records with the appropriate mesh blocks based on their geographical coordinates. This involves linking each data point to the corresponding mesh block within which it is located.

Tip:

Geospatial functions which are supported in big data warehouses and Python can be used to match geospatial data.

A common way to match two geographical objects is to see if the coordinates of the two objects intersect. An example of how to do this in Python and Snowflake is shown below.

In Python

Data matching can be done using the shapely library intersects function.

from shapely import wkt, intersects

shape1 = wkt.loads("POLYGON ((153.012021 -27.471741, 153.012021 -27.462598, 153.032931 -27.462598, 153.032931 -27.471741, 153.012021 -27.471741))")

shape2 = wkt.loads("POLYGON ((153.012021 -27.471741, 153.032931 -27.462598, 153.012021 -27.471741))")

shape_int = intersects(shape1, shape2)

print(shape_int)


In Snowflake

Data matching can be done using the ST_Intersects function. One of the advantages of using big data warehouses including Snowflake to geospatially match data is that it leverages its highly scalable infrastructure to quickly complete geospatial processing.

WITH geog_1 as (

SELECT ST_GEOGRAPHYFROMWKT('POLYGON ((153.012021 -27.471741, 153.012021 -27.462598, 153.032931 -27.462598, 153.032931 -27.471741, 153.012021 -27.471741))') as poly

),

geog_2 as (

SELECT ST_GEOGRAPHYFROMWKT('POLYGON ((153.012021 -27.471741, 153.022021 -27.465, 153.032931 -27.462598, 153.012021 -27.471741))') as poly

)

SELECT

g1.poly, g2.poly

FROM geog_1 as g1

INNER JOIN geog_2 as g2

on ST_INTERSECTS(g1.poly, g2.poly)

Step 5: Attribute Joining

If your dataset and mesh blocks data have common attributes (e.g., unique identifiers), perform attribute joins to combine information from both datasets. This allows you to enrich your dataset with additional details associated with mesh blocks.

Step 6: Quality Assurance

Verify the accuracy of the spatial integration by checking for any discrepancies or errors. Ensure that each data point is correctly associated with the corresponding mesh block.

Tip:

geojson.io is a handy website that can help with visualising geojson data and ensure it is correct.

If you’re using Snowflake, the ST_AsGeojson command can be used to convert geography into a geojson which allows you to quickly visualise the shapes created.

Step 7: Data Analysis and Visualisation

Leverage the integrated dataset for analysis and visualisation. Explore trends, patterns, and relationships within the data at the mesh block level. Utilise geospatial tools to create maps and visual representations of the information.

Tip:

It’s worth mentioning that Snowflake has the option to create a Streamlit app within the Snowflake UI which allows for the cleaning and processing of data using Python and SQL and the interactive visualisation of data through the Streamlit App.

Read our blog which demonstrates how to predict migration patterns and create forecasts using Snowpark and Streamlit>

Snowflake also integrates really well with local Python development environments so all the initial data processing and cleaning can be done through a Snowflake API, then geography can be converted to a GeoJson or Text formal. Thereafter, libraries like plotly, folium, pydeck can be used to do complex geospatial visualisations.

Step 8: Data Storage and Management

Establish a system for storing and managing the integrated dataset, ensuring that it remains up-to-date as new data becomes available.

Consider using databases or platforms that support geospatial data.

Tip:

Geospatial datasets are usually very large and complex datasets due to the number of attributes included in a geospatial dataset, the resolution of the data and the number of records.

Cloud-based big data platforms can be an excellent option for storing geospatial data due to the low-cost of storage. Many of these platforms including also have spatial clustering options so that geospatial data in a similar location are grouped together, meaning queries for data in certain areas run more efficiently.

Snowflake (Enterprise Edition or Higher) also has an option to add a search optimisation to geospatial data tables to optimise the performance of queries that use geospatial functions.

Step 9: Documentation

Document the integration process, including the source of mesh block boundaries, any transformations applied, and the methods used for data matching. This documentation is essential for transparency and replicability.

By following these above steps, you can effectively incorporate mesh blocks into your datasets, enabling a more detailed and location-specific analysis of the information at the mesh block level.


Geography – Boundaries & Insights – Australia

This free dataset from The Proptech Cloud is available for seamless access from Snowflake Marketplace.

The intellectual property rights for all content in this blog are exclusively held by Data Army and The Proptech Cloud. All rights are reserved, and no content may be republished or reproduced without express written permission from us. All content provided is for informational purposes only. While we strive to ensure that the information provided here is both factual and accurate, we make no representations or warranties of any kind about the completeness, accuracy, reliability, suitability, or availability with respect to the blog or the information, products, services, or related graphics contained on the blog for any purpose.

Subscribe to our newsletter

Subscribe to receive the latest blogs and data listings direct to your inbox.
Read more blogs from The Proptech Cloud

Crafting a Storm Surge and Hurricane Risk Rating for Coastal Properties

A high-level approach to developing a storm surge and hurricane risk rating system to guide stakeholders with a vested interest in coastal properties.

How Proptech Is Revolutionising Real Estate

Proptech is the dynamic intersection of property and technology, and it’s reshaping real estate. And there’s still a huge potential for growth.

What is the Australian Statistical Geography Standard (ASGS)?

The ASGS is used to better understand where people live and how communities are formed.

How to Incorporate Mesh Blocks into Datasets

Mesh blocks can enhance the precision and relevance of geospatial and proptech analyses. Here are some tips and steps to incorporate mesh blocks into datasets.

Australia’s Migration Trends: Where Are People Moving To?

This detailed visual analysis for Australia’s major capital cities breaks down how net migration trends are evolving across different regions.

Australia’s Migration Trends: Where Are People Moving To?

Australia’s Migration Trends: Where Are People Moving To?

Data consultancy, Data Army, delved into the Australia Post Movers Statistics dataset to understand where people are migrating to within Australia and predicting where they’re likely to move to next.

We explain the data visualisations created and documented in our previous blog How to Predict Migration Patterns using Auspost Movers Statistics Data and Snowflake’s Cortex ML functions>

By analysing movements and observing trends, we’re able to gather valuable insights to inspire decisions with data-driven intelligence.

How to Interpret the Data Visualisations

The visualisations below show the net migration metric for all Australian states.

Net migration is calculated by forecasting the number of people moving into an area subtracted by the number of people people moving out of an area.

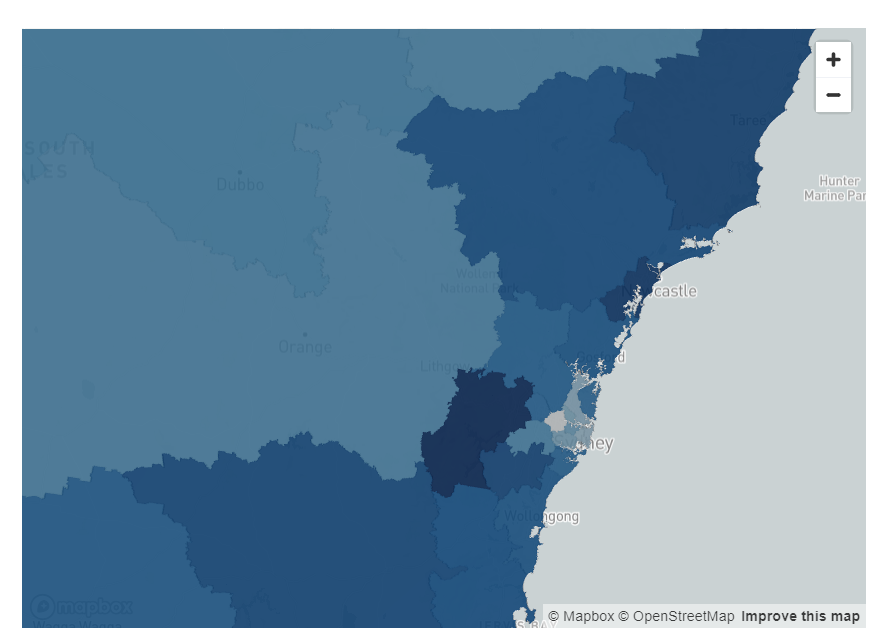
White, grey and lighter blue colours indicate regions with lower net migration, representing regions where a high number of people are leaving the regions and a lower number of people are relocating into these regions.

Mid to darker blue colours represent regions with higher net migration, regions where the number of people moving to those regions outweigh the number of people leaving those regions.

The Results by State


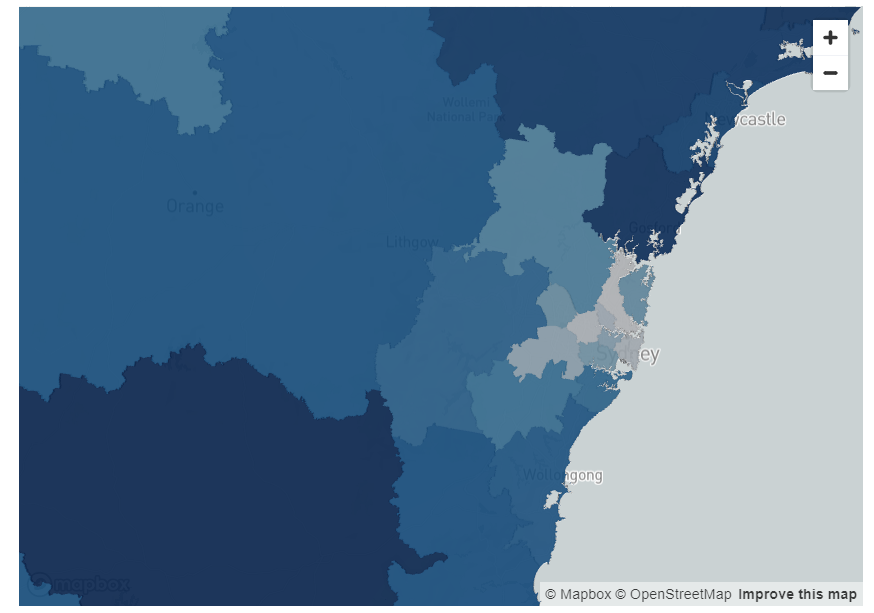
New South Wales (NSW)

In NSW, prior to the pandemic, the light blue areas in the inner city areas indicate there was some movement in inner city areas including Chatswood, the Sydney Central Business District (CBD) and areas just west of the city.

However, there was a much higher level of migration into the areas much further west of the city including Penrith and Blaxland, as well as Newcastle.

The trend of moving away from the city has further increased since the COVID pandemic in NSW, where areas very close to the city show the lowest forecasted net migration in the state.

This indicates that people are moving away from the city. Some possible explanations for these movements could be due to rising rents or potentially due to the fact that they no longer need to live within metropolitan areas for work.

In NSW, rural areas south of the city close to Canberra such as Goulburn, and rural areas north of Newcastle such as Taree are the regions with the highest amount of forecasted net migration as shown by the visualisations below.

NSW Pre-COVID
NSW Post-COVID

Figure 1: Pre- and post-COVID migration per SA4 for New South Wales

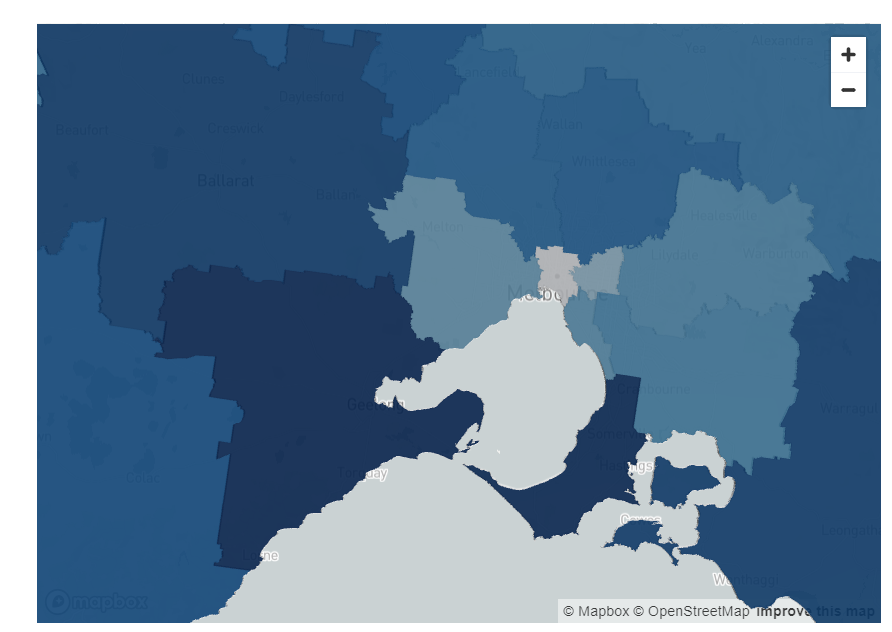
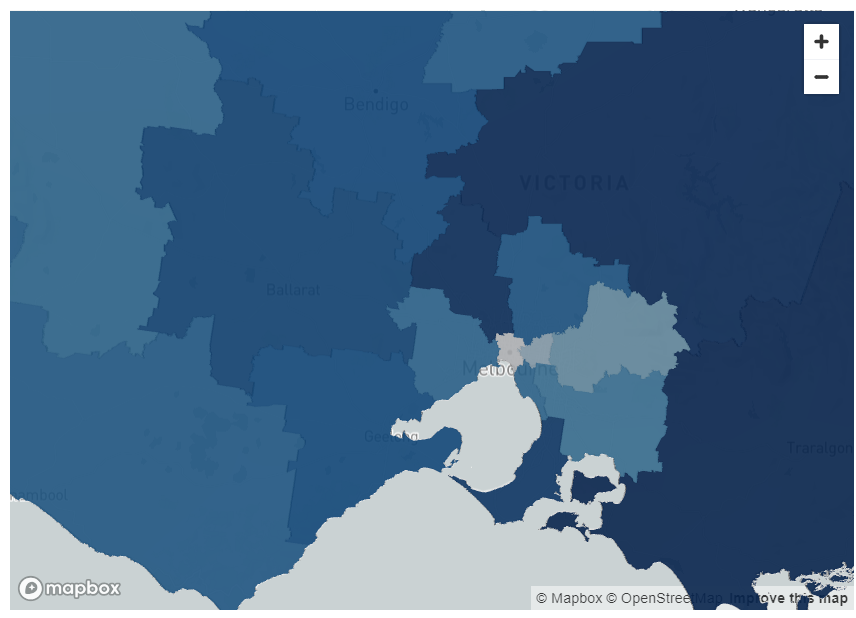
Victoria

A similar trend can be observed in Victoria. Both pre- and post-pandemic, the areas which had the lowest net migration were the inner city Melbourne suburbs of Brunswick, North Melbourne and Fitzroy.

However, prior to the pandemic, the areas with the highest forecasted net migration was Geelong and the south coast of Melbourne.

Post-COVID, the areas with the highest forecasted migration are even further away, possibly indicating these coastal areas are now also less desirable or unaffordable.

These include rural areas including Warragul and Taree. Greenfield suburbs just north of the city including Sunbury also have high levels of forecasted migration.

VIC Pre-COVID
VIC Post-COVID

Figure 2: Pre- and post-COVID migration per SA4 for Victoria

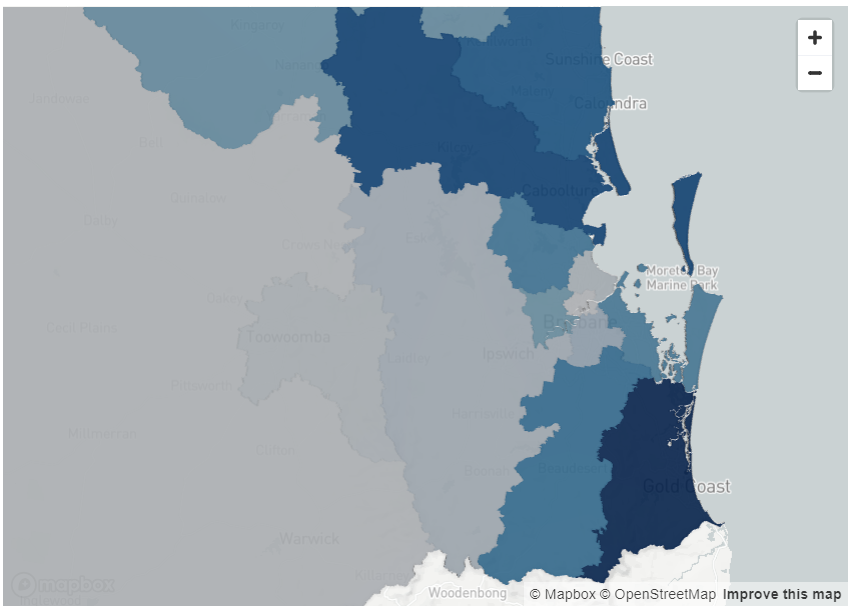
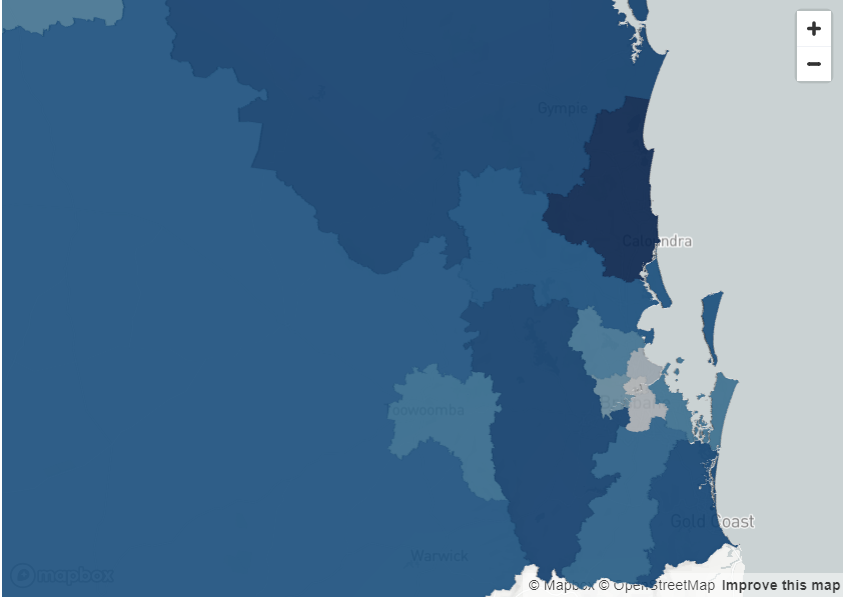
Queensland

Like Melbourne, the forecasts for net migration in the inner city part of Brisbane is relatively similar both pre- and post-pandemic.

The inner city areas have low levels of forecasted net migration.

Interestingly, the highest amount of forecasted migration in Queensland prior to the pandemic was in the Gold Coast, which is only approximately an hour from Brisbane CBD.

Post-pandemic, areas further west of the Brisbane city including Ipswich, and Harrisville have higher levels of forecasted migration.

This could be indicative of people from Queensland relocating, but could also suggest people from interstate or overseas moving from other locations to places west of the city.

There is also a high level of migration predicted for the Sunshine Coast post-pandemic, further highlighting the trend also observed in Sydney and Melbourne of people moving into more rural areas.

QLD Pre-COVID
QLD Post-COVID

Figure 3: Pre- and post-COVID migration per SA4 for Queensland

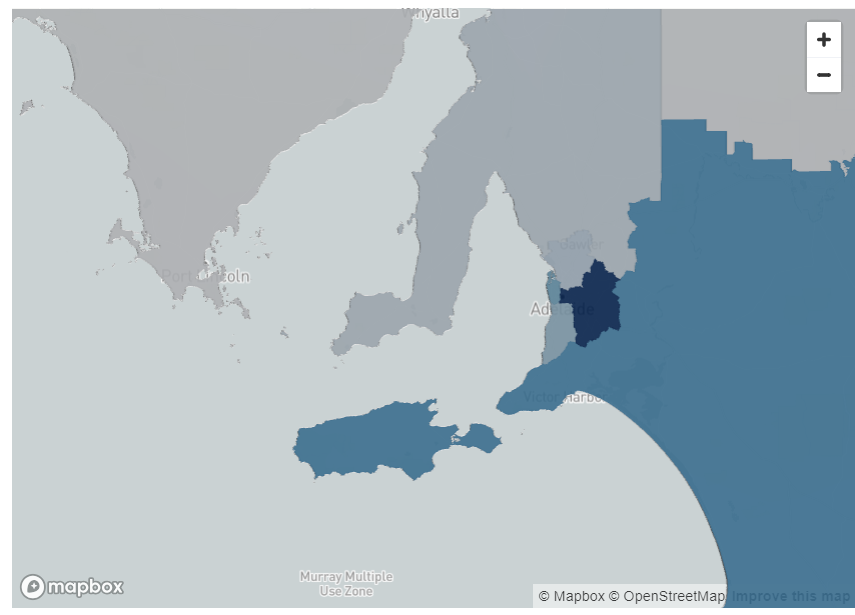
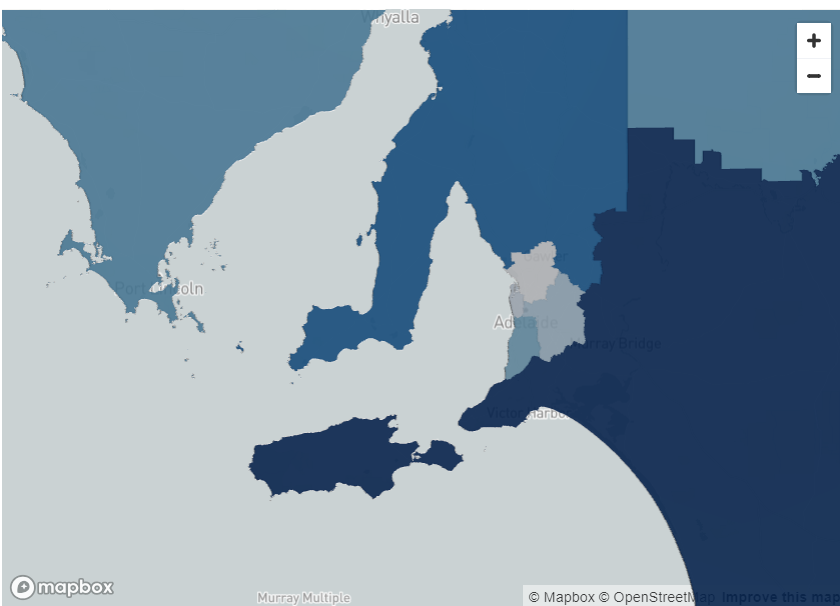
South Australia

South Australia, unlike NSW, Victoria and Queensland is one of the few states where the highest forecasted pre-pandemic net migration was in an inner-city area.

However, the trend to relocate to rural areas was very high post-pandemic. Rural areas including Kangaroo Island, Murray Bridge and Clare had much higher forecasted net migration after the pandemic. This supports the trend observed in the other states.

SA Pre-COVID
SA Post-COVID

Figure 4: Pre- and post-COVID migration per SA4 for South Australia

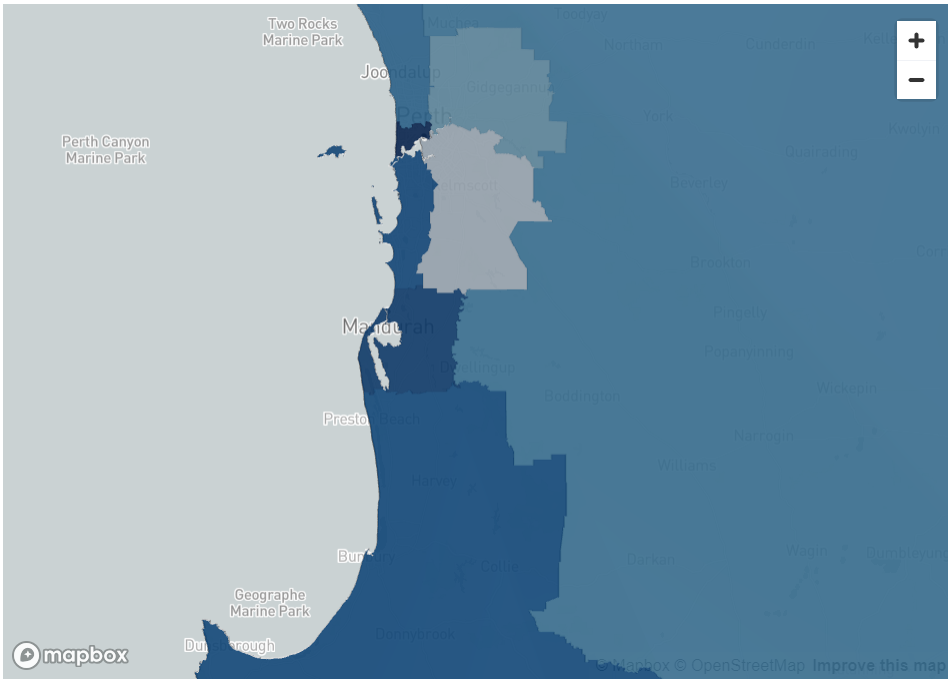
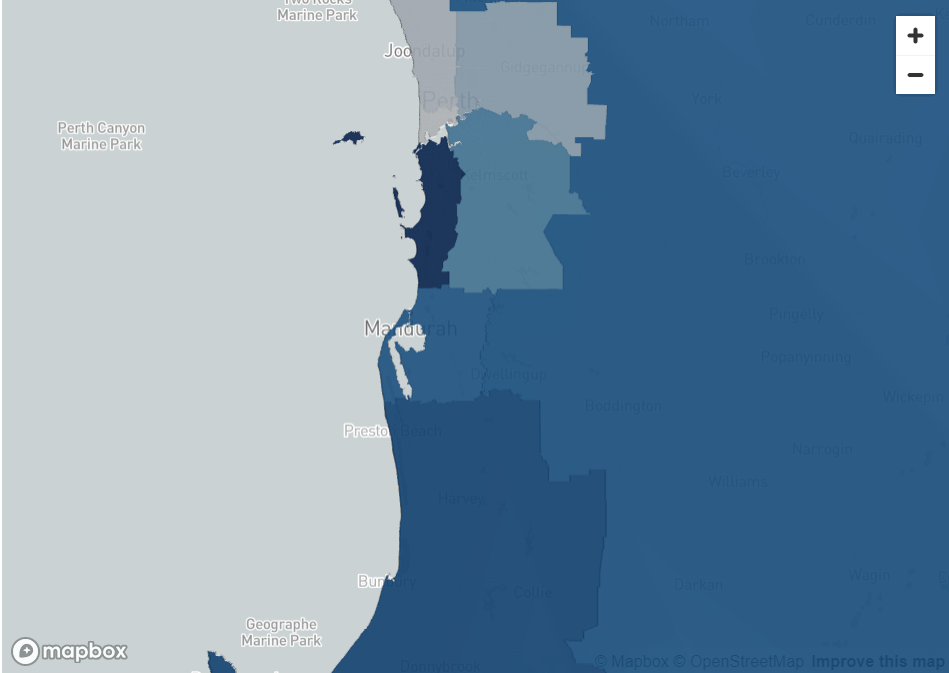
Western Australia

Western Australia is one of the few states where the forecasted net migration into rural areas is not high.

The pre-COVID migration forecasts indicate the highest level of net migration were in the Perth City area and post-COVID the highest amount of net migration was just south of the city.

One possible reason for this could be that while Perth house prices and rents have been rising, they are still much lower than Sydney or Melbourne, and therefore is still affordable for people to be able to live close to the city.

Secondly, as mining is the predominant industry in Western Australia, it is possible that it is not feasible for many of these workers to move and work remotely.

WA Pre-COVID
WA Post-COVID

Figure 5: Pre- and post-COVID migration per SA4 for Western Australia

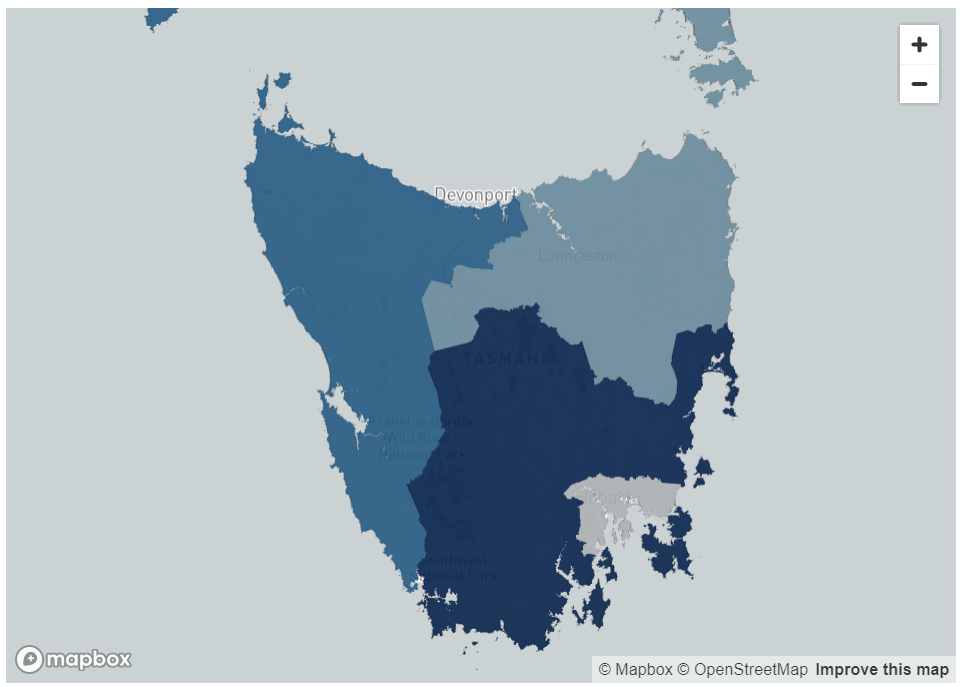
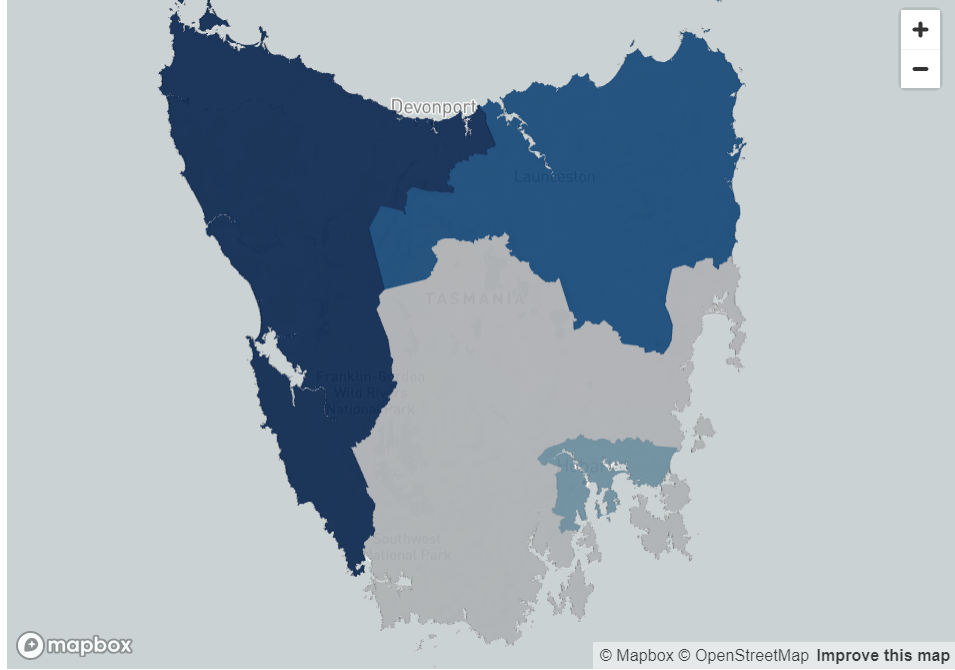
Tasmania

Tasmania is the only Australian state where the amount of net migration into the inner city forecasts are higher post-covid as compared to pre-COVID.

Prior to COVID , Hobart had the lowest net migration compared to all other regions in Tasmania. However, post-COVID the amount of met migration in the CBD is higher, indicating people are moving into Hobart.

Similarly, the amount of forecasted migration into Launceston, Tasmania’s second biggest city, is higher post-COVID as compared to pre-COVID.

The reason that the same rural migration has not been seen in Tasmania, unlike other states, could be because of Tasmania’s population.

Hobart’s population is only approximately 250,000 which is smaller than rural areas that people were migrating to including the Sunshine Coast.

Thus, the high rental and accommodation costs that are evident in highly populated cities, including Sydney or Melbourne may not be evident in Tasmania.

TAS Pre-COVID
TAS Post-COVID

Figure 6: Pre- and post-COVID migration per SA4 for Tasmania

​Summary of Findings

In the period post-COVID there is high evidence of people migrating to rural areas, especially in states with larger CBDs such as New South Wales, Victoria and Brisbane.

Interestingly, in these states, people seemed to be migrating to outer-city areas even prior to the pandemic.

This may suggest that there were factors encouraging people to move out of the city. This trend seems to have increased further since COVID.

Overall, there is a clear trend in the two most populated states, New South Wales and Victoria for net migration into rural areas.

These were the two states that were most affected by COVID lockdowns in Australia and have the highest house prices in the country which may be one of the key the drivers behind the high level of relocation to rural areas.

Less populated states including South Australia and Queensland have experienced a similar trend with high levels of net migration to rural areas including Kangaroo Island, Clare and the Sunshine Coast.

The only states that haven’t experienced net migration to rural areas are Western Australia and Tasmania.

A Reflection of Australia’s Housing Situation

Australia is in the midst of a housing crisis where steep house prices prevent many first-home buyers from entering the market, especially in inner-city areas.

Driven by the low supply of rentals and high post-pandemic migration, rents continue to skyrocket in many metropolitan cites.

In Australia’s most populous metropolitan areas Sydney and Melbourne, rents rose by 10.2% and 11.1%1 from December 2022 to December 2023 respectively.

Since 2020, the COVID pandemic has transformed the workplace environment, by forcing some office workers to do their job remotely due to lockdowns and government restrictions.

To this day, some office workers continue to work remotely full or part time, meaning that when picking a place to live, they may not need to prioritise being within a reasonable commuting distance from their usual physical office.

The combination of unaffordable rents and mortgages in inner city areas and increase in work from home trends may have contributed to many Australians migrating to outer-city and rural locations.

Strategic Insights

The findings hold significant strategic value for both the private and public sectors.

Incorporating these insights alongside additional data points, such as overseas migration into Australia, enriches the analysis, providing a more comprehensive understanding of migration patterns.

This broader perspective can enhance strategic planning and decision-making processes across various industries and governmental levels.

Examples include real estate development, investment, business expansion, transportation and infrastructure decisions, as well as urban, land use, policy or even healthcare and public services planning.

These findings can offer a foundation for both private and public sectors to adapt to changing demographic patterns in a way that maximises economic opportunities while ensuring community well-being and sustainability.

About The Analysis

Data Army used the Australian Post Movers Statistics dataset to base the forecasts in migration patterns during and after the COVID pandemic in each Australian state.

The primary dataset used in this study is the Australia Post Movers Statistics. It contains de-identified and aggregated data on moves across Australia based on mail redirection requests from the previous 5 years.

For this exercise, data from February 2019 to January 2024 was used.

Each entry in the data includes

  • the postcode the household relocated from,
  • the postcode the household relocated to,
  • the month of relocation, and
  • the number of the people that relocated.

This analysis shows forecasted migrated trends for the next year when pre-pandemic data is used (Feb 2019 – Jan 2020) compared to forecasts based on mail redirection requests in the post-pandemic era (2022-2024).

The analysis was conducted on a Statistical Area Level 4 level which are Australian Bureau of Statistics (ABS) defined regions that clearly distinguish inner-city areas, outer-city areas and rural areas.

For a step-by-step guide, see our blog on How to Predict Migration Patterns using Auspost Movers Statistics Data and Snowflake’s Cortex ML functions>

Australia Post Movers Statistics Data

This dataset contains five years of de-identified, aggregated information on past moves captured by Australia Post’s Mail Redirection service.

Access Australia Post mail redirect statistics now to help you develop competitive data-driven strategies.

The intellectual property rights for all content in this blog are exclusively held by Data Army and The Proptech Cloud. All rights are reserved, and no content may be republished or reproduced without express written permission from us. All content provided is for informational purposes only. While we strive to ensure that the information provided here is both factual and accurate, we make no representations or warranties of any kind about the completeness, accuracy, reliability, suitability, or availability with respect to the blog or the information, products, services, or related graphics contained on the blog for any purpose.

Subscribe to our newsletter

Subscribe to receive the latest blogs and data listings direct to your inbox.
Data consultancy, Data Army dives into the Australia Post Movers Statistics dataset to understand where people are migrating to within Australia and predicting where they’re likely to move to next.

We explain the data visualisations created and documented in our previous blog How to Predict Migration Patterns using Auspost Movers Statistics Data and Snowflake’s Cortex ML functions>

By analysing movements and observing trends, we’re able to gather valuable insights to inspire decisions with data-driven intelligence.

How to Interpret the Data Visualisations

The visualisations below show the net migration metric for all Australian states.

Net migration is calculated by forecasting the number of people moving into an area subtracted by the number of people people moving out of an area.

White, grey and lighter blue colours indicate regions with lower net migration, representing regions where a high number of people are leaving the regions and a lower number of people are relocating into these regions.

Mid to darker blue colours represent regions with higher net migration, regions where the number of people moving to those regions outweigh the number of people leaving those regions.

The Results by State


New South Wales (NSW)

In NSW, prior to the pandemic, the light blue areas in the inner city areas indicate there was some movement in inner city areas including Chatswood, the Sydney Central Business District (CBD) and areas just west of the city.

However, there was a much higher level of migration into the areas much further west of the city including Penrith and Blaxland, as well as Newcastle.

The trend of moving away from the city has further increased since the COVID pandemic in NSW, where areas very close to the city show the lowest forecasted net migration in the state.

This indicates that people are moving away from the city. Some possible explanations for these movements could be due to rising rents or potentially due to the fact that they no longer need to live within metropolitan areas for work.

In NSW, rural areas south of the city close to Canberra such as Goulburn, and rural areas north of Newcastle such as Taree are the regions with the highest amount of forecasted net migration as shown by the visualisations below.

NSW Pre-COVID
NSW Post-COVID

Figure 1: Pre- and post-COVID migration per SA4 for New South Wales

Victoria

A similar trend can be observed in Victoria. Both pre- and post-pandemic, the areas which had the lowest net migration were the inner city Melbourne suburbs of Brunswick, North Melbourne and Fitzroy.

However, prior to the pandemic, the areas with the highest forecasted net migration was Geelong and the south coast of Melbourne.

Post-COVID, the areas with the highest forecasted migration are even further away, possibly indicating these coastal areas are now also less desirable or unaffordable.

These include rural areas including Warragul and Taree. Greenfield suburbs just north of the city including Sunbury also have high levels of forecasted migration.

VIC Pre-COVID
VIC Post-COVID

Figure 2: Pre- and post-COVID migration per SA4 for Victoria

Queensland

Like Melbourne, the forecasts for net migration in the inner city part of Brisbane is relatively similar both pre- and post-pandemic.

The inner city areas have low levels of forecasted net migration.

Interestingly, the highest amount of forecasted migration in Queensland prior to the pandemic was in the Gold Coast, which is only approximately an hour from Brisbane CBD.

Post-pandemic, areas further west of the Brisbane city including Ipswich, and Harrisville have higher levels of forecasted migration.

This could be indicative of people from Queensland relocating, but could also suggest people from interstate or overseas moving from other locations to places west of the city.

There is also a high level of migration predicted for the Sunshine Coast post-pandemic, further highlighting the trend also observed in Sydney and Melbourne of people moving into more rural areas.

QLD Pre-COVID
QLD Post-COVID

Figure 3: Pre- and post-COVID migration per SA4 for Queensland

South Australia

South Australia, unlike NSW, Victoria and Queensland is one of the few states where the highest forecasted pre-pandemic net migration was in an inner-city area.

However, the trend to relocate to rural areas was very high post-pandemic. Rural areas including Kangaroo Island, Murray Bridge and Clare had much higher forecasted net migration after the pandemic. This supports the trend observed in the other states.

SA Pre-COVID
SA Post-COVID

Figure 4: Pre- and post-COVID migration per SA4 for South Australia

Western Australia

Western Australia is one of the few states where the forecasted net migration into rural areas is not high.

The pre-COVID migration forecasts indicate the highest level of net migration were in the Perth City area and post-COVID the highest amount of net migration was just south of the city.

One possible reason for this could be that while Perth house prices and rents have been rising, they are still much lower than Sydney or Melbourne, and therefore is still affordable for people to be able to live close to the city.

Secondly, as mining is the predominant industry in Western Australia, it is possible that it is not feasible for many of these workers to move and work remotely.

WA Pre-COVID
WA Post-COVID

Figure 5: Pre- and post-COVID migration per SA4 for Western Australia

Tasmania

Tasmania is the only Australian state where the amount of net migration into the inner city forecasts are higher post-covid as compared to pre-COVID.

Prior to COVID , Hobart had the lowest net migration compared to all other regions in Tasmania. However, post-COVID the amount of met migration in the CBD is higher, indicating people are moving into Hobart.

Similarly, the amount of forecasted migration into Launceston, Tasmania’s second biggest city, is higher post-COVID as compared to pre-COVID.

The reason that the same rural migration has not been seen in Tasmania, unlike other states, could be because of Tasmania’s population.

Hobart’s population is only approximately 250,000 which is smaller than rural areas that people were migrating to including the Sunshine Coast.

Thus, the high rental and accommodation costs that are evident in highly populated cities, including Sydney or Melbourne may not be evident in Tasmania.

TAS Pre-COVID
TAS Post-COVID

Figure 6: Pre- and post-COVID migration per SA4 for Tasmania

​Summary of Findings

In the period post-COVID there is high evidence of people migrating to rural areas, especially in states with larger CBDs such as New South Wales, Victoria and Brisbane.

Interestingly, in these states, people seemed to be migrating to outer-city areas even prior to the pandemic.

This may suggest that there were factors encouraging people to move out of the city. This trend seems to have increased further since COVID.

Overall, there is a clear trend in the two most populated states, New South Wales and Victoria for net migration into rural areas.

These were the two states that were most affected by COVID lockdowns in Australia and have the highest house prices in the country which may be one of the key the drivers behind the high level of relocation to rural areas.

Less populated states including South Australia and Queensland have experienced a similar trend with high levels of net migration to rural areas including Kangaroo Island, Clare and the Sunshine Coast.

The only states that haven’t experienced net migration to rural areas are Western Australia and Tasmania.

A Reflection of Australia’s Housing Situation

Australia is in the midst of a housing crisis where steep house prices prevent many first-home buyers from entering the market, especially in inner-city areas.

Driven by the low supply of rentals and high post-pandemic migration, rents continue to skyrocket in many metropolitan cites.

In Australia’s most populous metropolitan areas Sydney and Melbourne, rents rose by 10.2% and 11.1%1 from December 2022 to December 2023 respectively.

Since 2020, the COVID pandemic has transformed the workplace environment, by forcing some office workers to do their job remotely due to lockdowns and government restrictions.

To this day, some office workers continue to work remotely full or part time, meaning that when picking a place to live, they may not need to prioritise being within a reasonable commuting distance from their usual physical office.

The combination of unaffordable rents and mortgages in inner city areas and increase in work from home trends may have contributed to many Australians migrating to outer-city and rural locations.

Strategic Insights

The findings hold significant strategic value for both the private and public sectors.

Incorporating these insights alongside additional data points, such as overseas migration into Australia, enriches the analysis, providing a more comprehensive understanding of migration patterns.

This broader perspective can enhance strategic planning and decision-making processes across various industries and governmental levels.

Examples include real estate development, investment, business expansion, transportation and infrastructure decisions, as well as urban, land use, policy or even healthcare and public services planning.

These findings can offer a foundation for both private and public sectors to adapt to changing demographic patterns in a way that maximises economic opportunities while ensuring community well-being and sustainability.

About The Analysis

Data Army used the Australian Post Movers Statistics dataset to base the forecasts in migration patterns during and after the COVID pandemic in each Australian state.

The primary dataset used in this study is the Australia Post Movers Statistics. It contains de-identified and aggregated data on moves across Australia based on mail redirection requests from the previous 5 years.

For this exercise, data from February 2019 to January 2024 was used.

Each entry in the data includes

  • the postcode the household relocated from,
  • the postcode the household relocated to,
  • the month of relocation, and
  • the number of the people that relocated.

This analysis shows forecasted migrated trends for the next year when pre-pandemic data is used (Feb 2019 – Jan 2020) compared to forecasts based on mail redirection requests in the post-pandemic era (2022-2024).

The analysis was conducted on a Statistical Area Level 4 level which are Australian Bureau of Statistics (ABS) defined regions that clearly distinguish inner-city areas, outer-city areas and rural areas.

For a step-by-step guide, see our blog on How to Predict Migration Patterns using Auspost Movers Statistics Data and Snowflake’s Cortex ML functions>

Australia Post Movers Statistics Data

This dataset contains five years of de-identified, aggregated information on past moves captured by Australia Post’s Mail Redirection service.

Access Australia Post mail redirect statistics now to help you develop competitive data-driven strategies.

The intellectual property rights for all content in this blog are exclusively held by Data Army and The Proptech Cloud. All rights are reserved, and no content may be republished or reproduced without express written permission from us. All content provided is for informational purposes only. While we strive to ensure that the information provided here is both factual and accurate, we make no representations or warranties of any kind about the completeness, accuracy, reliability, suitability, or availability with respect to the blog or the information, products, services, or related graphics contained on the blog for any purpose.

Subscribe to our newsletter

Subscribe to receive the latest blogs and data listings direct to your inbox.
Data consultancy, Data Army dives into the Australia Post Movers Statistics dataset to understand where people are migrating to within Australia and predicting where they’re likely to move to next.

We explain the data visualisations created and documented in our previous blog How to Predict Migration Patterns using Auspost Movers Statistics Data and Snowflake’s Cortex ML functions>

By analysing movements and observing trends, we’re able to gather valuable insights to inspire decisions with data-driven intelligence.

How to Interpret the Data Visualisations

The visualisations below show the net migration metric for all Australian states.

Net migration is calculated by forecasting the number of people moving into an area subtracted by the number of people people moving out of an area.

White, grey and lighter blue colours indicate regions with lower net migration, representing regions where a high number of people are leaving the regions and a lower number of people are relocating into these regions.

Mid to darker blue colours represent regions with higher net migration, regions where the number of people moving to those regions outweigh the number of people leaving those regions.

The Results by State


New South Wales (NSW)

In NSW, prior to the pandemic, the light blue areas in the inner city areas indicate there was some movement in inner city areas including Chatswood, the Sydney Central Business District (CBD) and areas just west of the city.

However, there was a much higher level of migration into the areas much further west of the city including Penrith and Blaxland, as well as Newcastle.

The trend of moving away from the city has further increased since the COVID pandemic in NSW, where areas very close to the city show the lowest forecasted net migration in the state.

This indicates that people are moving away from the city. Some possible explanations for these movements could be due to rising rents or potentially due to the fact that they no longer need to live within metropolitan areas for work.

In NSW, rural areas south of the city close to Canberra such as Goulburn, and rural areas north of Newcastle such as Taree are the regions with the highest amount of forecasted net migration as shown by the visualisations below.

NSW Pre-COVID
NSW Post-COVID

Figure 1: Pre- and post-COVID migration per SA4 for New South Wales

Victoria

A similar trend can be observed in Victoria. Both pre- and post-pandemic, the areas which had the lowest net migration were the inner city Melbourne suburbs of Brunswick, North Melbourne and Fitzroy.

However, prior to the pandemic, the areas with the highest forecasted net migration was Geelong and the south coast of Melbourne.

Post-COVID, the areas with the highest forecasted migration are even further away, possibly indicating these coastal areas are now also less desirable or unaffordable.

These include rural areas including Warragul and Taree. Greenfield suburbs just north of the city including Sunbury also have high levels of forecasted migration.

VIC Pre-COVID
VIC Post-COVID

Figure 2: Pre- and post-COVID migration per SA4 for Victoria

Queensland

Like Melbourne, the forecasts for net migration in the inner city part of Brisbane is relatively similar both pre- and post-pandemic.

The inner city areas have low levels of forecasted net migration.

Interestingly, the highest amount of forecasted migration in Queensland prior to the pandemic was in the Gold Coast, which is only approximately an hour from Brisbane CBD.

Post-pandemic, areas further west of the Brisbane city including Ipswich, and Harrisville have higher levels of forecasted migration.

This could be indicative of people from Queensland relocating, but could also suggest people from interstate or overseas moving from other locations to places west of the city.

There is also a high level of migration predicted for the Sunshine Coast post-pandemic, further highlighting the trend also observed in Sydney and Melbourne of people moving into more rural areas.

QLD Pre-COVID
QLD Post-COVID

Figure 3: Pre- and post-COVID migration per SA4 for Queensland

South Australia

South Australia, unlike NSW, Victoria and Queensland is one of the few states where the highest forecasted pre-pandemic net migration was in an inner-city area.

However, the trend to relocate to rural areas was very high post-pandemic. Rural areas including Kangaroo Island, Murray Bridge and Clare had much higher forecasted net migration after the pandemic. This supports the trend observed in the other states.

SA Pre-COVID
SA Post-COVID

Figure 4: Pre- and post-COVID migration per SA4 for South Australia

Western Australia

Western Australia is one of the few states where the forecasted net migration into rural areas is not high.

The pre-COVID migration forecasts indicate the highest level of net migration were in the Perth City area and post-COVID the highest amount of net migration was just south of the city.

One possible reason for this could be that while Perth house prices and rents have been rising, they are still much lower than Sydney or Melbourne, and therefore is still affordable for people to be able to live close to the city.

Secondly, as mining is the predominant industry in Western Australia, it is possible that it is not feasible for many of these workers to move and work remotely.

WA Pre-COVID
WA Post-COVID

Figure 5: Pre- and post-COVID migration per SA4 for Western Australia

Tasmania

Tasmania is the only Australian state where the amount of net migration into the inner city forecasts are higher post-covid as compared to pre-COVID.

Prior to COVID , Hobart had the lowest net migration compared to all other regions in Tasmania. However, post-COVID the amount of met migration in the CBD is higher, indicating people are moving into Hobart.

Similarly, the amount of forecasted migration into Launceston, Tasmania’s second biggest city, is higher post-COVID as compared to pre-COVID.

The reason that the same rural migration has not been seen in Tasmania, unlike other states, could be because of Tasmania’s population.

Hobart’s population is only approximately 250,000 which is smaller than rural areas that people were migrating to including the Sunshine Coast.

Thus, the high rental and accommodation costs that are evident in highly populated cities, including Sydney or Melbourne may not be evident in Tasmania.

TAS Pre-COVID
TAS Post-COVID

Figure 6: Pre- and post-COVID migration per SA4 for Tasmania

​Summary of Findings

In the period post-COVID there is high evidence of people migrating to rural areas, especially in states with larger CBDs such as New South Wales, Victoria and Brisbane.

Interestingly, in these states, people seemed to be migrating to outer-city areas even prior to the pandemic.

This may suggest that there were factors encouraging people to move out of the city. This trend seems to have increased further since COVID.

Overall, there is a clear trend in the two most populated states, New South Wales and Victoria for net migration into rural areas.

These were the two states that were most affected by COVID lockdowns in Australia and have the highest house prices in the country which may be one of the key the drivers behind the high level of relocation to rural areas.

Less populated states including South Australia and Queensland have experienced a similar trend with high levels of net migration to rural areas including Kangaroo Island, Clare and the Sunshine Coast.

The only states that haven’t experienced net migration to rural areas are Western Australia and Tasmania.

A Reflection of Australia’s Housing Situation

Australia is in the midst of a housing crisis where steep house prices prevent many first-home buyers from entering the market, especially in inner-city areas.

Driven by the low supply of rentals and high post-pandemic migration, rents continue to skyrocket in many metropolitan cites.

In Australia’s most populous metropolitan areas Sydney and Melbourne, rents rose by 10.2% and 11.1%1 from December 2022 to December 2023 respectively.

Since 2020, the COVID pandemic has transformed the workplace environment, by forcing some office workers to do their job remotely due to lockdowns and government restrictions.

To this day, some office workers continue to work remotely full or part time, meaning that when picking a place to live, they may not need to prioritise being within a reasonable commuting distance from their usual physical office.

The combination of unaffordable rents and mortgages in inner city areas and increase in work from home trends may have contributed to many Australians migrating to outer-city and rural locations.

Strategic Insights

The findings hold significant strategic value for both the private and public sectors.

Incorporating these insights alongside additional data points, such as overseas migration into Australia, enriches the analysis, providing a more comprehensive understanding of migration patterns.

This broader perspective can enhance strategic planning and decision-making processes across various industries and governmental levels.

Examples include real estate development, investment, business expansion, transportation and infrastructure decisions, as well as urban, land use, policy or even healthcare and public services planning.

These findings can offer a foundation for both private and public sectors to adapt to changing demographic patterns in a way that maximises economic opportunities while ensuring community well-being and sustainability.

About The Analysis

Data Army used the Australian Post Movers Statistics dataset to base the forecasts in migration patterns during and after the COVID pandemic in each Australian state.

The primary dataset used in this study is the Australia Post Movers Statistics. It contains de-identified and aggregated data on moves across Australia based on mail redirection requests from the previous 5 years.

For this exercise, data from February 2019 to January 2024 was used.

Each entry in the data includes

  • the postcode the household relocated from,
  • the postcode the household relocated to,
  • the month of relocation, and
  • the number of the people that relocated.

This analysis shows forecasted migrated trends for the next year when pre-pandemic data is used (Feb 2019 – Jan 2020) compared to forecasts based on mail redirection requests in the post-pandemic era (2022-2024).

The analysis was conducted on a Statistical Area Level 4 level which are Australian Bureau of Statistics (ABS) defined regions that clearly distinguish inner-city areas, outer-city areas and rural areas.

For a step-by-step guide, see our blog on How to Predict Migration Patterns using Auspost Movers Statistics Data and Snowflake’s Cortex ML functions>

Australia Post Movers Statistics Data

This dataset contains five years of de-identified, aggregated information on past moves captured by Australia Post’s Mail Redirection service.

Access Australia Post mail redirect statistics now to help you develop competitive data-driven strategies.

The intellectual property rights for all content in this blog are exclusively held by Data Army and The Proptech Cloud. All rights are reserved, and no content may be republished or reproduced without express written permission from us. All content provided is for informational purposes only. While we strive to ensure that the information provided here is both factual and accurate, we make no representations or warranties of any kind about the completeness, accuracy, reliability, suitability, or availability with respect to the blog or the information, products, services, or related graphics contained on the blog for any purpose.

Subscribe to our newsletter

Subscribe to receive the latest blogs and data listings direct to your inbox.
Read more blogs from The Proptech Cloud

Crafting a Storm Surge and Hurricane Risk Rating for Coastal Properties

A high-level approach to developing a storm surge and hurricane risk rating system to guide stakeholders with a vested interest in coastal properties.

How Proptech Is Revolutionising Real Estate

Proptech is the dynamic intersection of property and technology, and it’s reshaping real estate. And there’s still a huge potential for growth.

What is the Australian Statistical Geography Standard (ASGS)?

The ASGS is used to better understand where people live and how communities are formed.

How to Incorporate Mesh Blocks into Datasets

Mesh blocks can enhance the precision and relevance of geospatial and proptech analyses. Here are some tips and steps to incorporate mesh blocks into datasets.

Australia’s Migration Trends: Where Are People Moving To?

This detailed visual analysis for Australia’s major capital cities breaks down how net migration trends are evolving across different regions.