Geohash vs H3: Which Geospatial Indexing System Should I Use?

Geohash vs H3: Which Geospatial Indexing System Should I Use?

For years, the go-to geospatial indexing system has been Geohash. However, a relative new contender has emerged, challenging the status quo – H3. So should you use Geohash or H3?

Here, we’ll explore the differences between Geohash and H3, to help you decide which geospatial indexing system best suits your needs.

Geohash: A Familiar Friend

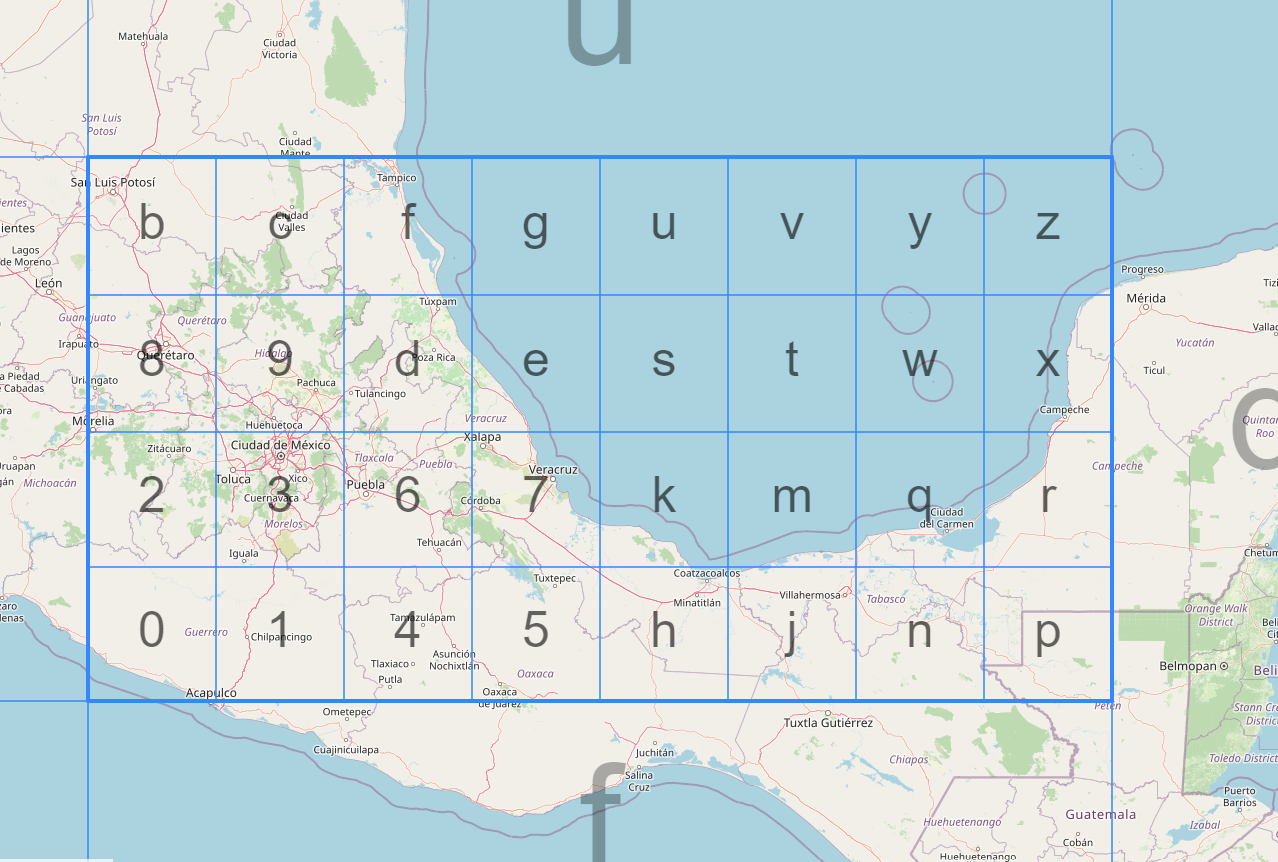
Geohash is a widely-used geocoding system that encodes geographic coordinates into a short string of letters and numbers. It divides the world into a grid of rectangles, each with a unique Geohash code. The longer the Geohash string, the more precise the location it represents.

H3: The Challenger

H3, on the other hand, is a relatively newer geospatial indexing system that’s gaining traction for its unique approach. Developed by ride-sharing company Uber, H3 uses a hexagonal grid to represent the Earth’s surface. Each hexagon is assigned a unique H3 index, offering a different perspective on geospatial indexing compared to Geohash.

Comparing Geohash and H3

We delve into the main differences between Geohash and H3 on a number of measures.

Precision

  • Geohash: Precision varies based on the length of the code. Longer codes are more precise, but this increases storage and complexity.
  • H3: H3 offers consistent precision regardless of location. Hexagons can be further subdivided for more precision, ensuring uniformity.

Spatial Relationships

  • Geohash: Geohash’s rectangular grid can struggle to represent spatial relationships accurately, especially near the poles (it should be noted that realistically, this is not going to be an issue in most use cases).
  • H3: H3’s hexagonal grid provides better spatial relationships, making it ideal for applications like ride-sharing services and navigation.

Support and Ease of Use

  • Geohash: Geohash is simple and widely adopted, making it easier to find resources and libraries for various programming languages.
  • H3: While H3 is gaining popularity, it may not have the same level of community support and resources as Geohash.

Applications

  • Geohash: Geohash is well-suited for applications that require basic geospatial indexing, such as location-based search or geofencing.
  • H3: H3 shines in complex applications like urban planning, logistics, and ride-sharing due to its consistent precision and better spatial relationships.

Scalability

  • Geohash: As Geohash codes get longer for more precision, storage and indexing can become inefficient.
  • H3: H3 scales more efficiently because it maintains uniform precision, regardless of location.
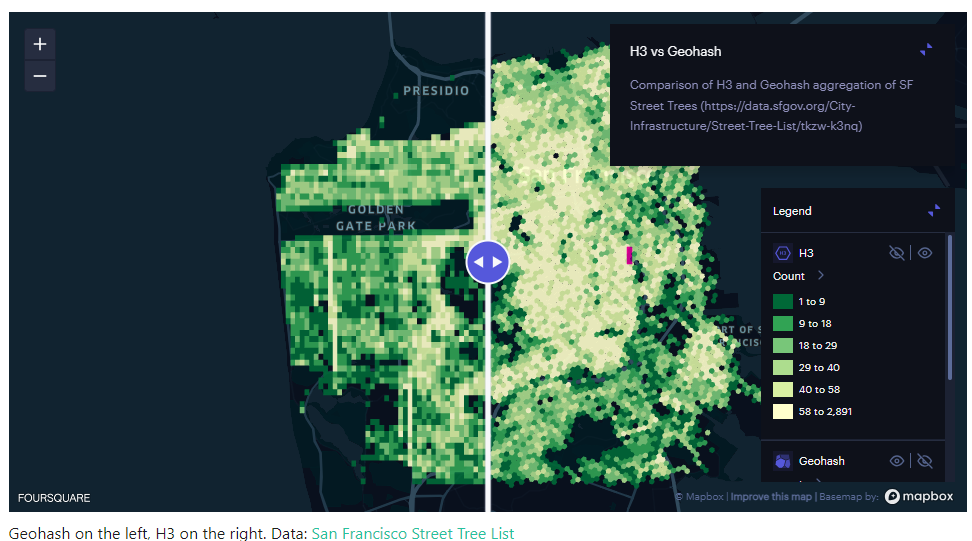
Geohash vs H3 Comparison

Source: H3

Geohash or H3: Choosing the right system

When it comes down to the choice between Geohash and H3, it really depends on your specific needs:

  • If you require a straightforward geospatial indexing system for basic applications, Geohash is a reliable choice with extensive community support.
  • On the other hand, if you’re dealing with complex spatial relationships, require consistent precision, or are working on innovative projects like urban planning or ride-sharing services, H3 offers a more promising solution. In the real estate context, it can be useful in urban planning, geofencing, spatial analysis, property market analysis.

Geospatial indexing is a fundamental technique used to manage and organise geographic or location-based data efficiently, in order to make data-based decisions or enhance applications.

Geohash is the old guard, tried and tested, while H3 is the newcomer with fresh ideas and uniform precision.

As we can see, both Geohash and H3 have their merits. However, the ultimate decision of which system to use should be based on the requirements of your project.

Snowflake releases H3 functionality

Snowflake provides SQL functions that enable you to use H3 with GEOGRAPHY objects.
This preview feature is now available to all accounts.

Read more blogs from The Proptech Cloud

Crafting a Storm Surge and Hurricane Risk Rating for Coastal Properties

A high-level approach to developing a storm surge and hurricane risk rating system to guide stakeholders with a vested interest in coastal properties.

How Proptech Is Revolutionising Real Estate

Proptech is the dynamic intersection of property and technology, and it’s reshaping real estate. And there’s still a huge potential for growth.

What is the Australian Statistical Geography Standard (ASGS)?

The ASGS is used to better understand where people live and how communities are formed.

How to Incorporate Mesh Blocks into Datasets

Mesh blocks can enhance the precision and relevance of geospatial and proptech analyses. Here are some tips and steps to incorporate mesh blocks into datasets.

Australia’s Migration Trends: Where Are People Moving To?

This detailed visual analysis for Australia’s major capital cities breaks down how net migration trends are evolving across different regions.

Geohashes and Efficient Geospatial Joins in Snowflake

Geohashes and Efficient Geospatial Joins in Snowflake

Geohashes are an incredibly useful tool when it comes to spatial analysis. They serve as an encoding system that translates geographic coordinates into a short string of letters and digits, which simplifies and optimises geospatial operations.

One area where geohashes shine is in making geospatial joins more efficient. In this blog, we’ll dive into what geohashes are, and how you can leverage Snowflake’s ST_GEOHASH function to improve your geospatial joins in Snowflake.

What is a geohash?

A geohash is a hierarchical spatial data structure that subdivides space into a grid of cells, each cell having a unique string identifier. Geohashes convert a two-dimensional geographic coordinate (latitude and longitude) into this alphanumeric string. The length of the string determines the precision of the geohash; a longer string means a more precise location.

Read our blog on What is a Geohash for a detailed overview.

Geohash

How geohashes make geospatial joins more efficient

Geospatial joins can be computationally expensive because they often require pairing each record in one dataset with every record in another to calculate distances or find overlaps. This can lead to a computational complexity of O(N*M), which is not ideal for large datasets.

Geohashes simplify this problem by converting the geospatial coordinates into strings. When you want to join based on geographic proximity, you can simply perform a string comparison, which is far less computationally expensive than a full spatial join.

Snowflake and ST_GEOHASH

Snowflake offers native support for geospatial functions, including ST_GEOHASH. Below is a simple example of how you can use this function to create a geohash in Snowflake:

-- Create a geohash for a specific latitude and longitude
SELECT ST_GEOHASH(37.7749, -122.4194, 12) AS geohash;
In this example, 37.7749 is the latitude, -122.4194 is the longitude, and 12 is the precision of the geohash.

To perform a geospatial join using geohashes, you can do the following:

-- Create two tables with geospatial data
CREATE TABLE locations1 (id INT, latitude FLOAT, longitude FLOAT);
CREATE TABLE locations2 (id INT, latitude FLOAT, longitude FLOAT);

-- Populate tables (this is just a representation)
-- ...

-- Add a geohash column to both tables
ALTER TABLE locations1 ADD COLUMN geohash STRING;
ALTER TABLE locations2 ADD COLUMN geohash STRING;

-- Update the geohash columns using ST_GEOHASH
UPDATE locations1 SET geohash = ST_GEOHASH(latitude, longitude, 12);
UPDATE locations2 SET geohash = ST_GEOHASH(latitude, longitude, 12);

-- Perform the join using the geohash
SELECT a.*, b.*
FROM locations1 a, locations2 b
WHERE a.geohash = b.geohash;


Geohash – Streamlining geospatial joins

Geohashes offer a streamlined way to perform geospatial joins, drastically reducing the computational resources required. With native functions like ST_GEOHASH in Snowflake, it’s easier than ever to incorporate geohashes into your geospatial workflows. By leveraging the power of geohashes, you can perform complex geospatial analyses more efficiently, saving both time and money.

Read more blogs from The Proptech Cloud

Crafting a Storm Surge and Hurricane Risk Rating for Coastal Properties

A high-level approach to developing a storm surge and hurricane risk rating system to guide stakeholders with a vested interest in coastal properties.

How Proptech Is Revolutionising Real Estate

Proptech is the dynamic intersection of property and technology, and it’s reshaping real estate. And there’s still a huge potential for growth.

What is the Australian Statistical Geography Standard (ASGS)?

The ASGS is used to better understand where people live and how communities are formed.

How to Incorporate Mesh Blocks into Datasets

Mesh blocks can enhance the precision and relevance of geospatial and proptech analyses. Here are some tips and steps to incorporate mesh blocks into datasets.

Australia’s Migration Trends: Where Are People Moving To?

This detailed visual analysis for Australia’s major capital cities breaks down how net migration trends are evolving across different regions.

What is H3?

What is H3?

There are a number of geospatial indexing systems which caters to spatial data types, query requirements, and use cases, with the choice often depending largely on the needs of your geospatial application and type of data. H3 is the relatively newer kid on the geospatial block, promising accuracy and scalability. Let’s delve in to understand its defining characteristics, how it works, and its practical applications.

What is H3?

H3 is a geospatial indexing system developed by Uber Technologies. It’s designed to partition the Earth’s surface into a hierarchical grid of hexagons. Each hexagon is assigned a unique H3 index, and this grid provides a way to represent and analyse geographic data with consistent precision.

In simpler terms, H3 is a way of breaking down the world into pieces, similar to how a jigsaw puzzle has pieces that fit together. These pieces are shaped like hexagons, like the honeycomb in a beehive.

These hexagons come in different sizes, so bigger hexagons can be used to talk about big areas like a country, whereas small hexagons can be used to talk about tiny areas like a neighbourhood.

Each of these hexagons is assigned a special code to help computers and maps understand where a place is on Earth. So instead of saying you’re at a certain latitude or longitude, you can simply give the code and your location can be pinpointed exactly.

Key characteristics of H3

  1. Hierarchical Grid
    This geospatial indexing system uses a hierarchical structure with multiple levels of hexagons. At each level, hexagons are subdivided into smaller hexagons, providing a scalable way to represent locations at different levels of detail.
  2. Uniform Precision
    Uniform precision across the globe means that hexagons at the same level of the hierarchy will represent approximately the same area, and are consistently spaced between hexagons.
  3. Spatial Relationships
    H3 provides better spatial relationships than traditional rectangular grids like latitude and longitude or Geohash. Hexagons have a more natural fit for mapping many real-world features and are less prone to distortions, especially near the poles.
  4. Resolution Levels
    By supporting multiple resolution levels, this system allows users to choose the appropriate level of detail for their application. Higher resolution levels provide more precision but may result in a larger number of hexagons to manage.
  5. Efficient Spatial Queries
    H3 makes it efficient to perform spatial queries, such as point-in-polygon tests, nearest-neighbor searches, and spatial aggregations. This is particularly valuable for applications like ride-sharing, logistics, and urban planning.
  6. Open Source
    H3 is open-source and available to the public, making it accessible for developers and researchers to use and contribute to its development.
  7. Geospatial Libraries
    H3 has been integrated into various geospatial libraries and programming languages, making it easier for developers to work with this geospatial indexing system in their applications.

How does H3 work?

Here’s a technical explanation of how H3 works:

  1. Hexagonal Grid
    H3 starts by subdividing the Earth’s surface into hexagonal grids. These hexagons are the basic building blocks of the system.
  2. Hierarchical Levels
    H3 employs a hierarchical approach with multiple zoom levels. At each zoom level, the hexagons are divided into smaller hexagons. This hierarchy allows for representing locations with varying levels of precision.
  3. Unique Hexagon IDs
    Each hexagon in the grid is assigned a unique identifier called an H3 index. These indices are used to identify specific geographic areas. An H3 index consists of two parts: a base cell and a resolution level. The base cell determines the general area, and the resolution level refines the precision within that area.

What does H3 look like?

This geospatial indexing system partitions the globe into hexagons for accurate analysis, as indicated in this image.

Geohash vs H3 Comparison

Source: Uber

Real estate applications of H3

As you can imagine, a geospatial indexing system developed by ride-share company, Uber would make it indispensable for ride-sharing and navigation, optimising driver and passenger matching, but also in determining best pickup and drop off points, fare calculations and route planning.

Due to its ability to represent geo locations accurately and analyse geographical data efficiently, it has wide appeal and vast uses in real-estate too. In most situations, anytime you might use the more commonly used Geohash, you could potentially use H3.

So, how does H3 compare?

H3 is one of the geospatial indexing systems at your disposal, answering to various spatial data types, query requirements, and use cases. However, the choice between using H3 and other indexing systems depends largely on the needs of your geospatial application and type of data.

Read how H3 and Geohash compare if you’re considering which system to adopt.

Snowflake releases H3 functionality

Snowflake provides SQL functions that enable you to use H3 with GEOGRAPHY objects.
This preview feature is now available to all accounts.

Read more blogs from The Proptech Cloud

Crafting a Storm Surge and Hurricane Risk Rating for Coastal Properties

A high-level approach to developing a storm surge and hurricane risk rating system to guide stakeholders with a vested interest in coastal properties.

How Proptech Is Revolutionising Real Estate

Proptech is the dynamic intersection of property and technology, and it’s reshaping real estate. And there’s still a huge potential for growth.

What is the Australian Statistical Geography Standard (ASGS)?

The ASGS is used to better understand where people live and how communities are formed.

How to Incorporate Mesh Blocks into Datasets

Mesh blocks can enhance the precision and relevance of geospatial and proptech analyses. Here are some tips and steps to incorporate mesh blocks into datasets.

Australia’s Migration Trends: Where Are People Moving To?

This detailed visual analysis for Australia’s major capital cities breaks down how net migration trends are evolving across different regions.

What is a Cadastre?

What is a Cadastre?

Cadastres are used extensively in real estate and beyond. We break down what they are, how they’re stored, used and maintained in Australia.

What is a cadastre?

A cadastre is a comprehensive register or database that captures detailed information about real estate or land within a specific jurisdiction; with each cadastral record defining its respective boundary, as determined by cadastral surveying. Important attributes such as property location, characteristics, and value are also included in a cadastre.

Essentially, it serves as a vital legal and administrative tool for managing and regulating land ownership and usage, while also used for collecting property taxes, assessing land values, and resolving any disputes related to properties. It typically contains property boundaries, ownership details, and physical descriptions, such as size, shape, and topography. It may even encompass additional information pertaining to land use, zoning regulations, building permits, and environmental regulations.

Which file types are typically used to store a cadastre?

These file types are commonly used to store a cadastre:

  • Shape file (.shp)
  • GDB (.gdb)
  • Geojson (.geojson)

File sizes of cadastre files can become quite large, depending on the extent of the coverage.

For example, the cadastre for New South Wales (NSW) in Australia is approximately 1.4 GB when compressed. Working with large files can be more manageable in cloud environments like Amazon Web Services (AWS). These cloud platforms provide substantial computing power that can be accessed when needed, then switched off in a pay-per-use model to more efficiently handle the processing requirements of large cadastre files.

Primarily spatial files, they contain geometry data that represents the boundaries of each land parcel within the cadastre. The geometry information can be stored and represented in various text formats, which are universally understood by spatial data software applications.

The most common approaches for storing and representing the geometries are

which ensure compatibility and ease of interpretation across different software tools and platforms.

Additional attributes relating to the cadastre can also be served within the same spatial file, such as through the properties key within a cadastre’s GeoJSON document. Other formats such as WKT or WKB do not support the direct inclusion of additional attributes to the geometry, but can be associated with in different ways such as in an accompanying csv file containing any additional attributes.

What does a cadastre look like on a map?

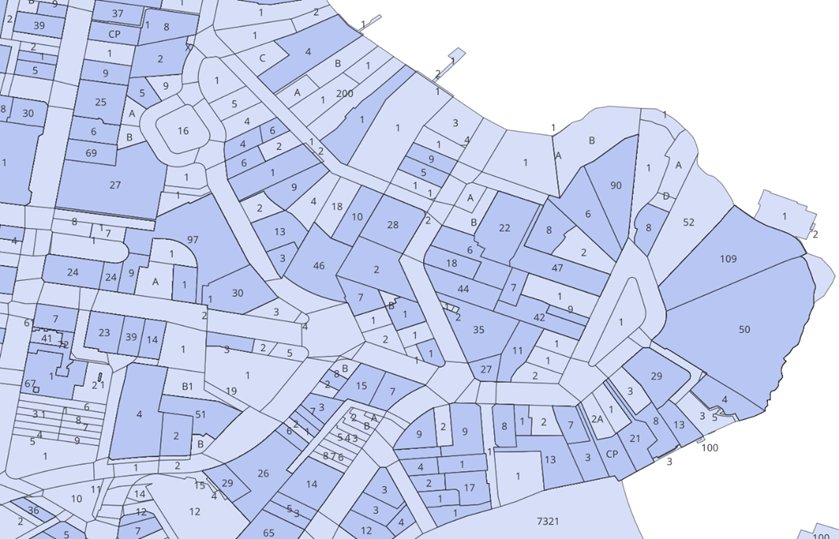
The way a cadastre is represented on a map can vary significantly depending on the source of the data and the configuration settings used in the mapping software. Different factors like styling, symbols, and labeling options can influence how the cadastre appears visually on the map.

The following image is a typical representation of cadastre on a map, showing boundary lines that delineate the various land parcels or lots. These boundary lines help visually separate one property from another. While lot numbers are used as an identifying label to provide a quick reference to specific parcels within the cadastre.

Cadastre represented on a map

How does a cadastre look in a Snowflake Marketplace listing?

To incorporate a cadastre into Snowflake, it needs to be transformed into a table structure. The process involves loading the cadastre data in the form of GeoJson as a VARIANT data type in Snowflake. Then the GeoJson features are flattened and converted into individual rows within the table.

Alternatively, the cadastre file can be converted to a flat file outside of Snowflake, then loaded into Snowflake as you would with any other flat file.

This flattening process makes it easier to query and analyse the cadastre data using standard SQL operations within Snowflake, allowing for efficient storage, retrieval, and analysis of the information.

Attribute {A}Attribute {B}Attribute {C}Geometry
123POLYGON((30 10, 40 40, 20 40, 10 20, 30 10))

*The actual columns (feature attributes) available for each piece of land registered on a cadastre is dependent on the maintainer/publisher of the cadastre.

Australian cadastres

In Australia, individual state and territory governments are responsible for the maintenance of cadastres, rather than the federal government.

Each state and territory has its own land administration agency responsible for maintaining cadastres within their jurisdiction.

The following organisations maintain cadastres:

These agencies are responsible for updating and managing the cadastre, including recording changes to property ownership, boundaries, and other relevant information. They also provide access to the cadastre and related services to the public, including title searches, property reports, and other land-related information.

Who provides cadastres on Snowflake Marketplace?

  • The Proptech Cloud
  • Geoscape
  • Precisely

What would a cadastre be used for?

Cadastres can be used to:

  • Identify the unique number of properties in a country,
  • Identify changes to properties (merges, subdivisions, title registrations),
  • Spatially link other spatial information to a property,
  • Spatially lookup a property based, i.e. lookup properties based on latitude and longitude coordinates, or based on geospatial shape (think drawing a circle on map to search for properties on the map),
  • Represent property boundaries on a map.

Read more blogs from The Proptech Cloud

Crafting a Storm Surge and Hurricane Risk Rating for Coastal Properties

A high-level approach to developing a storm surge and hurricane risk rating system to guide stakeholders with a vested interest in coastal properties.

How Proptech Is Revolutionising Real Estate

Proptech is the dynamic intersection of property and technology, and it’s reshaping real estate. And there’s still a huge potential for growth.

What is the Australian Statistical Geography Standard (ASGS)?

The ASGS is used to better understand where people live and how communities are formed.

How to Incorporate Mesh Blocks into Datasets

Mesh blocks can enhance the precision and relevance of geospatial and proptech analyses. Here are some tips and steps to incorporate mesh blocks into datasets.

Australia’s Migration Trends: Where Are People Moving To?

This detailed visual analysis for Australia’s major capital cities breaks down how net migration trends are evolving across different regions.

What’s the Difference Between GDA94 and GDA2020?

What’s the Difference Between GDA94 and GDA2020?

Geodetic datums, or geodetic systems, are often used by proptechs. Here is a rundown of everything you need to know about the different geodetic datums we use and reference in Australia.

What is a geodetic datum?

A geodetic datum is a set of reference points and parameters used to define the shape and orientation of the Earth’s surface for mapping and surveying purposes. It provides a coordinate system that allows locations on the Earth’s surface to be accurately described and located. In Australia, we use Geodetic Datum of Australia 1994(DA94) and Geodetic Datum of Australia 2020 (GDA2020).

History of Australia’s geodetic datums

Prior to GDA94, Australian surveyors primarily used the Australian Geodetic Datum 1966 (AGD66), which was based on a network of ground-based survey points and astronomical observations.

AGD66 was the standard datum used for mapping and surveying in Australia for several decades until it was superseded by GDA94 in the 1990s.

The decision to switch to GDA94 was driven by the need for a more accurate and up-to-date geodetic datum that could take advantage of advances in geospatial technology such as GPS. AGD66 was also affected by tectonic movements and other changes in the Earth’s surface, which made it increasingly difficult to use for accurate positioning and navigation.

GDA94 (Geocentric Datum of Australia 1994) was the geodetic datum used in Australia from 1994. Based on a mathematical model of the Earth’s surface defined using measurements from a network of ground-based survey points, and used as the standard datum for mapping and surveying in Australia.

Now, GDA2020 (Geocentric Datum of Australia 2020) is the current geodetic datum used in Australia. It was introduced in 2017 to replace GDA94 and is based on more recent measurements of the Earth’s surface using advanced satellite and ground-based technology.

GDA2020 provides a more accurate representation of the Earth’s surface than GDA94, and is designed to be compatible with global positioning systems (GPS) and other modern geospatial technologies.

Even though AGD66, and to some extent GDA94, are no longer the primary datums used in Australia, it’s still important to maintain historical data that was referenced to this datum. It is possible to transform data from AGD66 to GDA94 or GDA2020 using appropriate transformation parameters to ensure compatibility and accuracy when comparing or integrating data from different sources.

Conversions between geodetic datums

Conversions between AGD66 and GDA94 are not 100% accurate, because the two datums are based on different mathematical models of the Earth’s surface with different reference points and parameters.

To convert data from AGD66 to GDA94 (or vice versa), a mathematical transformation must be applied that takes the differences between the two datums into account. This transformation involves adjusting the latitude, longitude, and height values of the data to align with the new datum.

However, there are many factors that can affect the accuracy of this transformation, such as:

  1. The quality and accuracy of the original data: If the original data was collected using imprecise or inaccurate methods, the transformation may introduce additional errors or inaccuracies.
  2. The complexity of the transformation: Some transformations may require more complex mathematical models or additional parameters to be specified, which can increase the likelihood of errors.
  3. The location and terrain of the data: The accuracy of the transformation can vary depending on the location and terrain of the data. Some areas may be more affected by tectonic movements or other changes in the Earth’s surface, which can make the transformation more challenging.
  4. The type of data being transformed: Different types of data (e.g. points, lines, polygons) may require different transformation methods or parameters, which can affect the accuracy of the transformation.

While conversions between AGD66 and GDA94 can be relatively precise, they’re not 100% accurate. This is due to the inherent differences between the two datums, and the potential for errors or inaccuracies in the transformation process. It’s important to use appropriate transformation methods and understand the limitations and potential sources of error when converting data between different geodetic datums.

The difference between GDA94 and GDA2020

The key differences

The main difference between GDA94 and GDA2020 is their accuracy and the methods used to define them. GDA2020 is a more accurate and up-to-date datum, with improvements in the modeling of the Earth’s surface that take into account changes in its shape over time. This means that positions and distances measured using GDA2020 are more accurate than those measured using GDA94. Additionally, GDA2020 is designed to be compatible with modern geospatial technologies and is expected to be used for many years to come.

It’s worth noting that the difference between GDA94 and GDA2020 may not be significant for many applications, particularly those that don’t require high levels of accuracy. However, for applications that require precise positioning or measurement, such as surveying or mapping, using the correct geodetic datum is imperative to ensure accurate results.

Differences in distance and direction

The average distance and direction difference between GDA94 and GDA2020 depends on the location on the Earth’s surface. In general, the differences between the two datums are greatest in areas with high tectonic activity or areas where the Earth’s surface is undergoing significant changes, such as due to land subsidence or sea level rise.

According to Geoscience Australia, the organisation responsible for geodetic information and services in Australia, the average difference between GDA94 and GDA2020 in Australia is around 1.5 meters. However, this value can vary significantly depending on the location, with some areas showing differences of several meters or more.

The direction of the difference between the two datums also varies depending on the location, as it is related to the direction and magnitude of any tectonic movements or changes in the Earth’s surface. In general, the direction of the difference is determined by the vector between the two datums at a given location.

It’s important to note that the difference between GDA94 and GDA2020 is not constant over time and may continue to change in the future. This is because the Earth’s surface is constantly changing due to tectonic activity, sea level rise, and other factors. As such, it’s important to regularly update geodetic data and use the most up-to-date geodetic datum for accurate positioning and navigation.

Migrating from GDA94 to GDA2020

The differences between the two means that migrating from GDA94 to GDA2020 can present several challenges and issues, particularly for organisations or projects that rely heavily on geospatial data.

Some of the key issues with migrating to GDA2020 include: 

  1. Data compatibility: Data that was created using GDA94 may not be compatible with GDA2020. This can cause issues when trying to integrate or compare datasets that use different datums.
  2. Application compatibility: Applications that were designed to work with GDA94 may not be compatible with GDA2020. This can require updates or modifications to existing software or the adoption of new tools.
  3. Training and expertise: Staff who work with geospatial data may need to be trained on the new GDA2020 datum and its associated tools and workflows. This can take time and resources.
  4. Time and cost: Migrating to GDA2020 can be a complex and time-consuming process, particularly for large organisations or projects. There may be costs associated with updating software, purchasing new equipment, or retraining staff.
  5. Accuracy: While GDA2020 is a more accurate datum than GDA94, some existing data may still be more accurate when referenced to GDA94. This can make it difficult to compare or integrate data from different sources.
  6. Data transformation: In some cases, it may be necessary to transform data from GDA94 to GDA2020, which can introduce errors or inaccuracies. The accuracy of the transformation depends on the quality of the original data and the transformation method used.

Migrating from GDA94 to GDA2020 requires careful planning and consideration of the potential issues and challenges. It’s crucial to work closely with geospatial experts and stakeholders to ensure a smooth and successful transition.

What is WGS84 and why is it used by software?

WGS84 (World Geodetic System 1984) is a geodetic datum used for positioning and navigation purposes. It defines a reference system for the Earth’s surface that allows locations to be specified in latitude and longitude coordinates.

The WGS84 datum was developed by the United States Department of Defense for use by the military and intelligence agencies, but it has since become the standard geodetic datum used by many organisations and applications around the world, including GPS (Global Positioning System) devices and mapping software.

The WGS84 datum is based on a mathematical model of the Earth’s surface that takes into account its shape, size, and rotation. It defines a set of reference points and parameters that allow positions on the Earth’s surface to be accurately calculated and communicated.

The WGS84 datum is widely used because it is compatible with GPS and other global navigation systems, allowing precise positioning and navigation in real-time. However, while there may be regional differences in the Earth’s surface that are not fully captured by the WGS84 model, that other geodetic datums may be more appropriate for certain applications or regions.

How to convert between GDA2020 and WGS84

To convert between GDA2020 (Geocentric Datum of Australia 2020) and WGS84 (World Geodetic System 1984), you can use coordinate transformation parameters provided by geodetic authorities. The transformation process involves converting coordinates from one datum to another using a mathematical model.

In the case of GDA2020 and WGS84, the transformation parameters provided by the Intergovernmental Committee on Surveying and Mapping (ICSM) in Australia are known as the National Transformation Version 2 (NTv2) grid files. These grid files contain the necessary information for accurate transformations.

The accuracy of the transformation depends on the specific region and the quality of the NTv2 grid files used. Always use the most up-to-date and accurate transformation parameters available from reputable sources.

To convert coordinates between the GDA2020 (Geocentric Datum of Australia 2020) and WGS84 (World Geodetic System 1984) datums using Python, you can utilise the pyproj library. pyproj provides a convenient interface to the PROJ library, which is a widely used cartographic projection and coordinate transformation library.

Usage in Australia

In Australia, a lot of data providers are providing data sets in both GDA94 and GDA2020 geodetic datums because the uptake of GDA2020 is not universal. Most data providers of spatial data sets will reference the geodetic datum used to build the data set.

When combining geospatial data sets, ensure you are using a consistent geodetic datum to prevent incorrectly linking two or more shapes.

Read more blogs from The Proptech Cloud

Crafting a Storm Surge and Hurricane Risk Rating for Coastal Properties

A high-level approach to developing a storm surge and hurricane risk rating system to guide stakeholders with a vested interest in coastal properties.

How Proptech Is Revolutionising Real Estate

Proptech is the dynamic intersection of property and technology, and it’s reshaping real estate. And there’s still a huge potential for growth.

What is the Australian Statistical Geography Standard (ASGS)?

The ASGS is used to better understand where people live and how communities are formed.

How to Incorporate Mesh Blocks into Datasets

Mesh blocks can enhance the precision and relevance of geospatial and proptech analyses. Here are some tips and steps to incorporate mesh blocks into datasets.

Australia’s Migration Trends: Where Are People Moving To?

This detailed visual analysis for Australia’s major capital cities breaks down how net migration trends are evolving across different regions.