How to Develop a Comprehensive Wildfire Risk Rating for Properties

How to Develop a Comprehensive Wildfire Risk Rating for Properties

The Australian 2019/2020 bushfire season is one of the world’s worst in recent memory. It began in November 2019 in New South Wales and spread across Victoria, Western Australia, South Australia, and the Australian Capital Territory. The extensive fires, fueled by high temperatures and prolonged dry conditions, led to widespread devastation, with a number of lives lost, thousands of homes destroyed or damaged and billions of dollars worth of agricultural damage.

Australia frequently experiences both bushfires and grass fires.

These fires are a natural and integral part of Australia’s environment. Many Australian plants and animals have evolved to not only survive but also benefit from the effects of fire, with some flora depending on fire to assist in its reproduction and growth.

According to Australia State of the Environment 2021, bushfires include all types of fires in the bush – prescribed burns for weed control, cultural burns, fuel reduction burns and wildfires.

Wildfires are bushfires that are out of control, whether they are managed fires that have escaped control or fires that were not deliberately lit.

With the increasing prevalence of bushfires and wildfires globally, assessing the risk they pose to people, properties and infrastructure has become more critical than ever.

Steps to Develop a Wildfire Score Rating

A Wildfire Risk Rating score provides a quantifiable measure of this risk, guiding governments, financial institutions, insurance companies, homeowners, developers and buyers in making informed decisions.

Here we’ll outline a high-level structured approach to developing a comprehensive wildfire risk rating for properties.

1. Defining scoring criteria and scale

Firstly, we establish a scoring scale, typically from 1 (lowest risk) to 5 or 10 (highest risk). It’s important to define clear criteria that contribute to bushfire or wildfire risk, ensuring a comprehensive evaluation.

2. Key factors to consider

Several factors play a pivotal role in determining fire risks:

    • Location and topography

      Proximity to fire-prone areas and the property’s topography can significantly influence risk levels.
      Tools like Archistar have features to determine if your site is in a bushfire-prone zone. With built-in bushfire layers, Archistar can provide accurate and reliable data.

    • Vegetation and landscaping

      The type and maintenance of vegetation around a property are crucial, as some plants are more flammable than others.Australia’s unique geography and climate makes it prone to bushfires. In Australia, hazard reduction burns or prescribed burns are controlled fires undertaken by fire agencies, land managers or by rural landholders to remove vegetation. These are often conducted ahead of the warmer summer months as a means of mitigating the impact of bushfires and reducing fire risks.

      Examples include Forest Fire Management Victoria Reducing Bushfire Risk program and the ACT Government’s Fire Management Policies and Plans aim to reduce the risk of bushfires.

    • Climate and weather patterns

      Weather is a key driver of bushfire ignitions, with a number of factors affecting wildfire activity. Many factors contribute to fire weather, such as a lack of rainfall in the lead-up period, low humidity, strong winds and high temperatures, which all contribute to fire risk on any given day. They can also increase moisture stress on vegetation in the lead-up period.

      Local climate, current and historical weather patterns, including wind conditions and drought frequency, are critical considerations in the development of a Wildfire Risk Rating.

Weather patterns
  • Historical wildfire data

    Historical wildfire data is important because understanding past wildfire occurrences in the area helps predict future risks.
    There is a range of open data sources for historical bushfire data. In Australia, the Australian Government shares a range of bushfire related datasets on data.gov.au and University of NSW shares 100 Years of Bushfire Data.

    This type of data, combined with other data sets conveniently accessible from the one location, the Snowflake Marketplace, can help to develop a fuller picture about historical wildfire in specific areas. For example:

    • Access and infrastructure

      Good access for firefighters and robust utility infrastructure are important for fire response and prevention.

    3. Data collection and analysis

    Gathering relevant data, such as GIS mapping, climate data, and historical fire records, is the next step.

    The Proptech Cloud curates a range of useful datasets available on Snowflake Marketplace to make this process easier.

    Analysing this data allows us to assign a sub-score to each factor based on our scale.

    4. Assigning weights to each factor and calculating the overall score

    Each factor is assigned a weight according to its impact on bushfire risk.

    This step is essential to ensure that more critical factors have a greater influence on the overall score.

    By combining these sub-scores and considering their respective weights, we calculate the property’s overall Wildfire Risk Rating.

    5. Validation and adjustment

    It’s important to validate the scoring system against historical bush and wildfire incidents and expert opinions, adjusting it as necessary for accuracy and reliability.

    6. Regular updates

    As environmental conditions and land use change, it’s important to regularly update the scoring system to maintain its relevance and accuracy.

    The Role of Wildfire Risk Rating

    A well-structured wildfire risk rating is an invaluable tool, helping property stakeholders to understand, assess, and mitigate the risks posed by bushfires. By adopting this methodical approach, we can enhance our preparedness and response to this growing environmental threat.

    Subscribe to our newsletter

    Subscribe to receive the latest blogs and data listings direct to your inbox.

    Read more from The Proptech Cloud

    What Is A Geohash And How Is It Used?

    Discover what a geohash is, how it works, and its real-world applications in mapping, logistics and data analysis.

    What Is A Cadastre?

    Learn how cadastres capture property boundaries, ownership details, and values, and see how technology is transforming them with 3D models, GIS and digital platforms.

    Top Property and Proptech Events in Australia 2025

    These industry events provide valuable opportunities to learn from industry leaders, explore emerging technologies, and network with peers who are shaping the future of the sector.

    The Shifting Landscape of Property Ownership in Australia

    Uncover the ways in which fintech and proptech are revolutionising property ownership in Australia, making it more accessible and dynamic than ever before.

    Parcels, Titles, Addresses and Properties. What’s The Difference?

    ​Parcels, titles, addresses and properties. These terms are often used interchangeably in real estate, but are they the same thing?

    Environmental Risks in Real Estate: Essential Metrics for Assessment

    Environmental Risks in Real Estate: Essential Metrics for Assessment

    Driven by greater awareness and demand, environmental considerations are increasingly at the forefront of property development and investment.

    Environmental factors can significantly impact site selection, regulatory compliance, property values, safety, infrastructure, sustainability, insurance costs, and the overall desirability of real estate.

    To adequately build resilient properties for our future, understanding and assessing environmental risks in real estate is crucial.

    Examining the key metrics and statistics used to measure these risks can also provide valuable insights for property stakeholders who are building climate intelligence as a means of value creation and strategic differentiation in the real estate industry.

    On the other hand, the real estate industry contributes approximately 39% of total global emissions. This highlights how factors as broad as the choice of building materials, construction methods, real estate planning and development can influence and help to mitigate global climate change and environmental risk.

    Environmental assessment metrics provide important intel to stakeholders and businesses in and around the real estate industry. 

    Here we examine the top 16 key metrics used in assessing environmental risk in real estate.

    1. Flood Risk Assessment

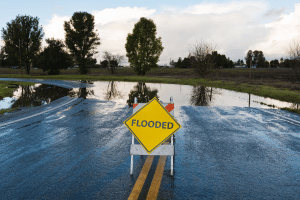
    Managing flood risk is an important aspect of adapting to global climate change and flood risk assessments have become an important part of risk management practices. The estimation of risk is somewhat challenging and involves careful consideration of a number of varying factors such as location, historical flood data, and elevation.

    Flood risk is a concern, especially for properties near water bodies.

    Flood

    2. Earthquake Risk Score

    In earthquake-prone areas, earthquake risk score is vital. It evaluates the probability of earthquakes and their potential impact, factoring in seismic activity and building standards.

    Earthquake risk metrics can support stakeholders in developing risk reduction measures such as emergency response plans, building design codes, or insurance-related decisions.

    3. Wildfire Risk Rating

    Properties in or near wilderness areas must consider the risk of wildfires. This rating looks at location, vegetation, and climate conditions. There are a number of data and solutions in the market that help decision makers with deeper location intelligence insights, such as CoreLogic with their climate risk solutions and Precisely with their wildfire risk data.

    Then there are those protech innovators who actively incorporate environmental risks into their solutions, such as Nearmap who’ve recently acquired BetterView, will also be integrating risk ratings for data decisions given the ever-changing nature of bush fires, floods, and other disasters.

    4. Storm Surge and Tsunami Risk

    While storm surges and tsunamis are caused by different events, they both have the potential to cause significant harm and damage, such as substantial erosion of beaches and coastal highways, and waves pose a threat to boats and buildings along the shoreline. As the surging waters move inland, rivers and lakes may experience adverse effects, contributing to the escalation of flood levels.

    Coastal properties are evaluated for their vulnerability to storm surge and tsunamis, crucial in today’s changing climate.

    Sea levels

    5. Sea Level Rise Projections

    With climate change, assessing the long-term risk of sea level rise is essential for coastal real estate investments.

    Climate Central’s Coastal Risk Screening Tool is a handy tool for quick future projections.

    6. Air Quality Index (AQI)

    Air pollution stands as the most significant environmental threat to global public health, resulting in an approximate annual total of 7 million premature deaths.

    AQI impacts property desirability and occupant health, making it a significant factor in urban and industrial areas.

    7. Soil Contamination Levels

    Soil contamination can limit property use and affect value, necessitating thorough assessments.

    Australian soil information is collected by government and held by the states and territories. Soil Science Australia, the national soil science body, shares a handy list of Soils Data, Maps and Information Sources for reference.

    Soil

    8. Water Quality Assessments

    Our water systems, including surface and groundwater, catchments, as well as estuarine and marine bodies, constitute intricate ecological networks that we engage with daily. These waterways and wetlands play an important role in:

    • Providing drinking water
    • Supporting irrigation and agriculture
    • Receiving and purifying effluent and stormwater
    • Facilitating recreational and commercial activities such as fishing and boating.

    The quality of local water sources is a key consideration, as it affects usability and desirability

    9. Heat Island Effect

    Urban areas influence the surrounding atmosphere and engage with climate processes, resulting in distinct microclimates within cities.

    This heat island phenomenon leads to urban areas experiencing notably higher temperatures compared to their surroundings, particularly in areas with limited green cover and increased hard surfaces that absorb, retain, and emit heat.

    Urban heat islands can increase energy costs and affect living conditions, and is an important factor in urban planning.

    10. Noise Pollution Levels

    The World Health Organization (WHO) recognises noise pollution—defined as unfavorable noise caused by human activity—as an underestimated threat that can cause a number of short- and long-term health problems.

    As well as contributing to health, noise pollution is often seen as a less-than-desirable attribute contributing to liveability.

    Properties exposed to high noise levels from traffic or industry can affect their value.

    11. Environmental Regulation Compliance

    In Australia, compliance with legislation including protection of threatened plants, animals and ecosystems, wildlife trade, hazardous waste, air quality and monitoring compliance with the conditions of approvals granted under the Environment Protection and Biodiversity Conservation Act 1999 (EPBC Act) is conducted by The Department of Climate Change, Energy, the Environment and Water.

    Compliance with environmental regulations is critical to avoid legal issues and maintain property value.

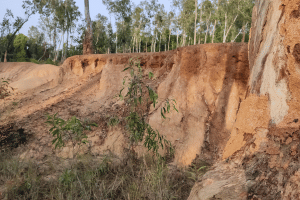
    Soil erosion

    12. Land Stability and Erosion Rates

    Land stability and erosion rates is affected by soils, surface cover, topography, and climate; all of which are interrelated.

    Particularly in areas with unstable soils or steep terrain, assessing the risk of landslides or erosion is essential for many aspects of real estate such as site selection, development planning and insurance, while these risks can also have an influence on property valuations.

    13. Proximity to Hazardous Facilities

    Numerous research studies have indicated a correlation between living in close proximity to sites with hazardous wastes, industrial facilities, pesticide-treated cropland, busy roadways, nuclear power plants, and gas stations or repair shops, result in an increased likelihood of detrimental health effects.

    Government may form regulations and implement procedures for permits and enforcement to limit pollution.

    As such, properties in close proximity may face increased regulations, risks or insurance costs.

    14. Biodiversity and Wildlife Protection Areas

    With a sustained need for housing, urban planners and conservation managers are consistently exploring alternative strategies for residential development that aim to reduce adverse effects on biodiversity and ecosystem functioning.

    Thus, proximity to protected areas can limit development options and affect property value.

    Biodiversity

    15. Carbon Footprint Analysis

    Climate change is already underway, with an escalating impact that is increasingly affecting all of us around the globe.

    Without immediate and systemic action to address its destructive consequences, the impact is expected to be substantial.

    For greater visibility into the environmental footprint of transactions and impacts of our consumption and production activities, organisations such as FootprintLab provide current, credible and commercially ready carbon data. This information can aid consumers, producers and governments in decision-making that aligns with their sustainability goals.

    Managing carbon emissions from the construction industry is one crucial step in limiting these effects on climate change and a property’s carbon footprint is becoming a significant factor in light of global climate concerns.

    16. Sustainability Certifications

    A green building certification is a verification process ensuring that a building is designed and constructed to enhance energy efficiency, decrease water usage, foster a healthier indoor environment, manage resources and waste effectively, and limit environmental impact.

    The process generally requires adherence to specific guidelines and criteria, often assessed by an accredited third-party organisation, leading to the certification of the building.

    There are different green building certifications around the globe, with LEED in the United States, BREEAM in the United Kingdom and NABERS in Australia, each with its own set of criteria and scoring systems.

    Properties with these certifications are often seen as less risky and more desirable.

    The Proptech Cloud’s Environment and Energy Efficiency Data provides energy supply data and NABERS energy rating data to guide decisions on energy sourcing as part of a robust sustainability strategy.

    Managing Environmental Risks

    Understanding and mitigating environmental risks is important in the real estate sector. By using these metrics, stakeholders can make informed decisions, adapt to environmental challenges, uncover business opportunities and invest in sustainable and resilient properties.

    As the world continues to focus on environmental sustainability, these considerations will become increasingly integral to real estate assessment and development.

    Subscribe to our newsletter

    Subscribe to receive the latest blogs and data listings direct to your inbox.

    Read more from The Proptech Cloud

    What Is A Geohash And How Is It Used?

    Discover what a geohash is, how it works, and its real-world applications in mapping, logistics and data analysis.

    What Is A Cadastre?

    Learn how cadastres capture property boundaries, ownership details, and values, and see how technology is transforming them with 3D models, GIS and digital platforms.

    Top Property and Proptech Events in Australia 2025

    These industry events provide valuable opportunities to learn from industry leaders, explore emerging technologies, and network with peers who are shaping the future of the sector.

    The Shifting Landscape of Property Ownership in Australia

    Uncover the ways in which fintech and proptech are revolutionising property ownership in Australia, making it more accessible and dynamic than ever before.

    Parcels, Titles, Addresses and Properties. What’s The Difference?

    ​Parcels, titles, addresses and properties. These terms are often used interchangeably in real estate, but are they the same thing?

    Understanding the Real Estate Market: Key Metrics and Statistics

    Understanding the Real Estate Market: Key Metrics and Statistics

    Navigating the real estate market can be complex, whether you’re a buyer, seller, investor, or industry analyst. One of the keys to understanding this dynamic market is to familiarise yourself with the various metrics and statistics that measure real estate activity.

    These indicators provide invaluable insights into market trends, pricing dynamics, and overall economic health.

    We’ll cover some of the most common metrics used in real estate analysis to help stakeholders better understand this dynamic market.

    1. Sales Volume

    Sales volume indicates the total number of properties sold in a specific period. This metric is a primary measure of market activity. Relatively high sales volumes often point to a robust market, while lower volumes may signal a slowdown.

    A number of organisations offer this data in Australia, usually by state or even postcode for a laser focused lens on particular areas of interest:

    • HtAG
    • CoreLogic
    Property sales

    2. Median Sale Price

    The median sale price identifies the middle value in a list of property sale prices. This metric offers a realistic snapshot of the market’s pricing level, avoiding the skewing effect of extremely high or low prices.

    3. Average Sale Price

    The average sale price is calculated by dividing the total value of all sales by the number of transactions.

    The average sale price provides a broader perspective of the market’s general pricing trends.

    For sale

    4. Days on Market (DOM)

    As its name suggests, DOM tracks the number of days a property spends on the market before being sold.

    Shorter DOM periods typically indicate a seller’s market, whereas longer DOMs suggest a buyer’s market.

    5. Listing Inventory

    Inventory is the count of the number of properties which are actively marketed and listed for sale, also referred to as “active listings” or “homes for sale.”

    Understanding the number of properties available for sale at any given time helps gauge the supply side of the market equation.

    6. Absorption Rate

    The absorption rate is a real estate metric that assesses how quickly homes are being sold in a particular market over a set period. It is determined by dividing the number of homes sold during that time by the total available homes.

    Additionally, this formula can be flipped to determine how long it would take to sell the existing supply.

    This rate measures the speed at which the market is ‘absorbing’ or selling off its current inventory, offering insight into market demand.

    7. Price per Square Metre (or Square Foot)

    This metric is calculated by dividing the sale price by the property’s total square metres (or footage).

    This metric is handy because it allows for a direct comparison between different properties of varying prices and floor space.

    8. Rent Prices and Yields

    Rental yield is calculated by subtracting the total costs of your investment from the income generated by renting out your property. Typically represented as a percentage, a higher yield indicates increased cash flow and a more favourable return on investment.

    For investment properties, monitoring rent prices and yields (rental income as a percentage of property value) is crucial.

    Soil

    9. Foreclosure Rates

    Foreclosure happens when a lender seizes a property because the person who took out a mortgage fails to make the required payments.

    Foreclosure involves a legal procedure where the property’s title is transferred from the homeowner (borrower) to the lender, who then sells the property.

    The purpose of selling the property is for the lender to recover the outstanding loan amount.

    The process is usually lengthy and doesn’t simply occur because a homeowner misses just one repayment; it occurs with more substantial lapse in payments.

    The number of properties in foreclosure can indicate both the health of the real estate market and broader economic conditions.

    10. Mortgage Interest Rates

    Mortgage interest is the cost a lender charges for taking the risk of lending you money. The mortgage interest rate directly affects your repayments – the higher the interest rate, the bigger your payments will be.

    This is why mortgage interest rates on home loans significantly influence buyer demand and market dynamics.

    11. Construction Starts

    The number of new building projects indicates future supply and market confidence.

    The Proptech Cloud’s data listing contains statistics for Australian construction activity helpful for planning, demand forecasting and construction cycle timing.

    The Australian government publishes building activity visualisations which shows dwelling construction trends over time, and the Australian Bureau of Statistics provides estimates of value of building work and number of dwellings commenced, completed, under construction and in the pipeline.

    Soil erosion

    12. Building Permits Issued

    Building permits are papers which confirm that a planned building follows the rules set by authorities. It’s a written approval from a building surveyor, either private or municipal.

    This statistic reflects the level of future construction activity and developer sentiment.

    13. Vacancy Rates

    Vacancy rates indicate how many rental homes in an area are currently empty and available for rent. To find this rate, take the number of empty homes in that area and divide it by the total number of homes available for rent.

    In rental or commercial properties, the percentage of unoccupied units at a given time can signal market health.

    14. Capitalisation Rate (Cap Rate)

    Especially relevant in commercial real estate, the cap rate helps estimate the return on an investment property.

    To find the cap rate, take the property’s yearly income (after subtracting expenses) and divide it by the property’s value. This rate is useful for comparing how good of an investment a property is compared to others in the same area.

    If a property has a higher cap rate, it means there’s more risk involved. And usually, when the cap rate is higher, the property’s value is lower because its yearly income is less.

    Biodiversity

    The Use of Property Metrics and Statistics

    These metrics provide distinctive perspectives on the real estate market. Depending on your role—whether you’re a buyer, renter, investor, realtor, or other stakeholder in real estate—each metric carries unique value, caters to different requirements, and provides diverse insights.

    By understanding and analysing these indicators, stakeholders can make more informed decisions, predict market trends, and grasp the market’s broader economic implications.

    Regardless of whether you’re a seasoned professional or a curious observer, keeping an eye on these statistics is key to understanding the complexities of the real estate world.

    Subscribe to our newsletter

    Subscribe to receive the latest blogs and data listings direct to your inbox.
    Read more from The Proptech Cloud

    What Is A Geohash And How Is It Used?

    Discover what a geohash is, how it works, and its real-world applications in mapping, logistics and data analysis.

    What Is A Cadastre?

    Learn how cadastres capture property boundaries, ownership details, and values, and see how technology is transforming them with 3D models, GIS and digital platforms.

    Top Property and Proptech Events in Australia 2025

    These industry events provide valuable opportunities to learn from industry leaders, explore emerging technologies, and network with peers who are shaping the future of the sector.

    The Shifting Landscape of Property Ownership in Australia

    Uncover the ways in which fintech and proptech are revolutionising property ownership in Australia, making it more accessible and dynamic than ever before.

    Parcels, Titles, Addresses and Properties. What’s The Difference?

    ​Parcels, titles, addresses and properties. These terms are often used interchangeably in real estate, but are they the same thing?

    Top 11 Uses for Weather Data in Real Estate

    Top 11 Uses for Weather Data in Real Estate

    Weather data plays a significant role in many facets of real estate.

    Businesses involved at each stage of the property lifecycle across a range of industries and professions use weather data, together with other key data points, to make important strategic decisions.

    Here we highlight the top 11 property-related processes where weather data serves as a valuable tool and why.

    Zoning and land use

    1. Zoning and Land Use

    Government bodies and local councils consider weather data in planning decisions about zoning, development and land use to ensure the safety, sustainability, and functionality of urban areas. Examples include flood risk assessment, to avoid and manage heat islands, wildfire risk assessments, infrastructure resilience and emergency preparedness.

    2. Location Selection, Urban Planning and Development

    Urban planners and developers use historical data to make informed decisions about where to build new properties and infrastructure.

    This data can help them identify areas with low risk of natural disasters and favourable climate conditions, which can impact liveability and attract more buyers and tenants.

    Similarly, real estate developers and businesses considering new locations could use this data to make informed decisions about where to invest. Climate considerations affect the attractiveness of a location for both residential and commercial purposes. Investors in real estate often rely on historical data to formulate their investment strategies.

    3. Building Design

    Weather data has a substantial influence on building design and the choice of materials when creating structures that are not only functional but also durable, energy-efficient, and comfortable.

    Heating and cooling, orientation, precipitation, weather events, energy efficiency and sustainability are just a handful of the factors considered by architects, engineers, and construction professionals in building design.

    As weather patterns develop, longer-term planning of climate resilient developments that can withstand climate changes will rely on historical weather trends and patterns.

    Weather data influences building design

    4. Construction Planning and Forecasting

    Weather data is used very broadly in building construction.

    Project scheduling of weather dependent tasks and site preparations; optimising resources, tradespeople and equipment; safety planning; the handling, logistics and protection of construction materials; environmental compliance all factor into construction planning and building contractual agreements.

    Weather has such a profound impact on productivity and safety in the construction industry that a host of construction software, apps and technologies have emerged to improve the efficiency of planning, communication and management procedures and build resilience. And the companies developing this construction software incorporate weather data!

    An example is UBIMET, an organisation specialised in high-precision meteorology and international weather services. Their range of offerings include weather solutions that allow construction companies to make informed decisions about their development projects.

    5. Innovative Data-Based Engineering and Concept Designs

    Weather data could be used in research and development, design or data-driven engineering (a framework for a new approach to technical product development), particularly of smart products in our built environment.

    Engineers and designers can use this data to help plan, redesign and improve the design process and verify design concepts¹.

    Smart products in the built environment
    Seasonal property demand is influenced by weather

    6. Seasonal Property Demand

    At a simplistic level, weather data can help predict seasonal fluctuations in property demand, both in purchase and rental.

    Real estate agents, and holiday rental marketers often use this data to target regions, seasons, highlight favourable weather conditions and seasonal attractions when promoting properties and timing campaigns.

    For instance, a beachfront property may be marketed with historical or even real-time weather data showcasing sunny days and warm temperatures.

    7. Property Protection, Maintenance and Repairs

    Property managers may reference historical data to safeguard properties, anticipate environmental wear and tear, and gauge maintenance and repair needs, particularly in regions with higher risks of severe or extreme weather incidences.

    Weather data is crucial in assessing suitability of land for agricultural purposes

    8. Agricultural Real Estate

    In rural areas, weather data is crucial for assessing the suitability of land for agricultural purposes.

    Historical data can provide insights into factors like rainfall patterns, temperature ranges, and frost dates, which are vital for farming and land use decisions.

    9. Risk Assessment

    Weather and climate risk impacts all real estate assets in a broad sense. Weather data can help assess the potential risks associated with a property.

    Historical data allows buyers, sellers, and investors to make informed decisions regarding property investments by understanding the past occurrences and potential risks.

    Real estate risk assessments influence building design and construction; investor and asset manager decisions; insurance industry processes; banking and home loans; government resourcing and funding of community assistance services, policies and programs, just to name a few.

    It has also given rise to a host of proptech tools, which ingest this weather data, to help stakeholders assess the risk to their real estate assets. An example of a climate risk report tool is ClimateCheck, and The World Bank offers climate and disaster risk screening tools designed to build resilience measures into project design.

    Weather data plays a role in the valuation of property

    10. Property Valuation

    Historical weather data, among other factors, impact property prices and property valuation. While it may not be the sole determinant of property value, it can influence valuations, particularly in areas of weather-related risks.

    And weather conditions can also impact insurance costs, desirability, liveability and saleability. Banks, real estate agents, government bodies and councils, property developers and investors are amongst those who would have a vested interest in the valuation of a property.

    11. Insurance Planning

    Weather data is vital for insurance planning.

    Property owners or tenants rely on historical weather data to assess the risk of damage from weather-related incidents such as storms, flooding, or wildfires. This information can help them choose the right insurance coverage and understand potential insurance costs.

    On the flip side, insurance companies use weather data to analyse and assess the risk when calculating premiums associated with insuring a property. Data analytics of weather information could also assist as a tool in identifying potential fraudulent cases.

    Weather data has a versatile range of uses and plays a crucial role in all areas of the property lifecycle.

    And judging by the range of weather intelligence software in market, weather data also plays a crucial role in software development to aid a wide range of industries, not just in real estate.

    Weather data not only enhances property-related decisions but also fuels innovation in proptech, ushering in a new era of data-driven solutions that may help guide the buying, selling, construction and management of properties.


    Source:
    ¹Ang Liu , Yuchen Wang , Xingzhi Wang, (2022) Data-Driven Engineering Design, Switzerland: Springer Cham

    Weather Data Listings

    The Proptech Cloud curates a range of weather data listings for use in real estate processes and analysis.

    Subscribe to our newsletter

    Subscribe to receive the latest blogs and data listings direct to your inbox.

    Read more from The Proptech Cloud

    What Is A Geohash And How Is It Used?

    Discover what a geohash is, how it works, and its real-world applications in mapping, logistics and data analysis.

    What Is A Cadastre?

    Learn how cadastres capture property boundaries, ownership details, and values, and see how technology is transforming them with 3D models, GIS and digital platforms.

    Top Property and Proptech Events in Australia 2025

    These industry events provide valuable opportunities to learn from industry leaders, explore emerging technologies, and network with peers who are shaping the future of the sector.

    The Shifting Landscape of Property Ownership in Australia

    Uncover the ways in which fintech and proptech are revolutionising property ownership in Australia, making it more accessible and dynamic than ever before.

    Parcels, Titles, Addresses and Properties. What’s The Difference?

    ​Parcels, titles, addresses and properties. These terms are often used interchangeably in real estate, but are they the same thing?

    The Role of Data in Real Estate Decisions

    The Role of Data in Real Estate Decisions

    Businesses use a wide range of data to confidently analyse trends, forecast changes, and identify opportunities. In today’s competitive real estate industry, the data behind informed business decisions can be the difference between success and failure.

    Why is data-driven decision-making so important in real estate?

    With the advent of big data and accessibility of data, companies are now able to make more accurate and strategic decisions by analysing information, key trends and metrics. Data-driven decision-making has become critical in real estate because it allows businesses to identify opportunities, reduce risks and maximise returns on investments.

    Using data in real-estate decisions

    Some examples may include:

    • Real estate investment decisions

      Real estate and related data as diverse as historical sales data, demographics, market demand, property valuations can be used to identify profitable investment and development opportunities, determine a value of a property and assess potential returns on property investments.

    • Retail analytics

      Property data together with foot traffic data, demographics, sales data, can play a role in location selections and market expansion decisions. It will also influence merchandising decisions such as retail promotions and campaigns, product placement, store layout and inventory management.

    • Real estate sales decisions

      By analysing current and historical market trends, businesses can determine optimal pricing strategies for properties. Similarly demographic data can be used to identify the target audience for a particular property and inform advertising and marketing efforts.

    • Mortgage and financing decisions

      For risk assessments, lenders use property data to evaluate the value and condition of collateral for mortgage loans, determining loan eligibility and interest rates.
      On the flipside, credit scoring models may incorporate property data to evaluate borrower creditworthiness.

    • Government and urban planning

      Urban planners use property data to identify areas in need of infrastructure development, such as roads, schools, and utilities. Governments may use property data to enforce zoning regulations and property tax assessments.

    • Building and construction planning

      Property data aids in estimating construction costs, project timelines, and feasibility studies.

    • Insurance underwriting and claims

      Insurers consider property data when determining premiums and coverage for homeowners and property insurance policies. Property data may play a role in processing claims by verifying property details and assessing damage.

    • Environmental impact assessment

      Property, environmental, regulatory and geospatial data may all factor into decisions made concerning property projects.

    Tips for interpreting and analysing property data

    While data-driven decision-making is a valuable tool in real estate, it is important to understand how to properly analyse and interpret property data.

    Here are some tips to keep in mind:

    • Data Accuracy

      Ensure the data you’re using is accurate and up-to-date. Rely on reputable sources and verify the information where possible.

    • Compare and Contrast

      Don’t make decisions based on a single data point. Compare property data from different sources and periods to identify trends and outliers.

    • Consider Context

      Understand the broader economic and market context in which the data exists. External factors like interest rates, local regulations, and economic conditions can significantly impact real estate data.

    • Data Visualisation

      Utilise data visualisation tools to transform complex data sets into easy-to-understand graphs and charts. Visual representations can highlight patterns and trends.

    • Consult Experts

      When in doubt, seek advice from experienced proptech professionals or data scientists and analysts. They can provide valuable insights and guidance in interpreting property data effectively.

    • Human Judgement

      Don’t ignore intuition and personal experience entirely. Data is important, but it should be used to inform decisions, not replace human judgement.

    As we’ve explored, various types of data play a pivotal role in shaping business decisions. In an era of big data and accessible information, real estate professionals have the tools at their disposal to analyse trends, forecast changes, and seize opportunities like never before.

    Businesses can navigate the intricate terrain of real estate with greater precision, with data illuminating the path.

    Human judgment and expertise are still indispensable. Seek out experts, draw from your intuition, and let data guide your decisions, not dictate them.

      Read more from The Proptech Cloud

      What Is A Geohash And How Is It Used?

      Discover what a geohash is, how it works, and its real-world applications in mapping, logistics and data analysis.

      What Is A Cadastre?

      Learn how cadastres capture property boundaries, ownership details, and values, and see how technology is transforming them with 3D models, GIS and digital platforms.

      Top Property and Proptech Events in Australia 2025

      These industry events provide valuable opportunities to learn from industry leaders, explore emerging technologies, and network with peers who are shaping the future of the sector.

      The Shifting Landscape of Property Ownership in Australia

      Uncover the ways in which fintech and proptech are revolutionising property ownership in Australia, making it more accessible and dynamic than ever before.

      Parcels, Titles, Addresses and Properties. What’s The Difference?

      ​Parcels, titles, addresses and properties. These terms are often used interchangeably in real estate, but are they the same thing?

      Unlocking Affordable Housing in Australia: The Data Revolution

      Unlocking Affordable Housing in Australia: The Data Revolution

      Australia’s property market has been a subject of discussion for years, fuelled by soaring prices, scarcity, and affordability issues. Enter proptech start-ups, which are leveraging technology to offer innovative solutions to these issues. Central to this wave of innovation is data, and its accessibility is being revolutionised by digital data marketplace platforms.

      The Old Guard: Barriers to Entry

      Historically, one of the largest barriers to entry for proptech start-ups was access to quality data. Whether it’s property values, zoning laws, ownership, or construction costs, such data sets are often fragmented, expensive, or behind bureaucratic walls. The effort and capital required to acquire and harmonise this data kept many potential innovators out of the space.

      Complicating matters further, there is a noticeable lack of skilled data engineers available to streamline the complex process of data collection and integration, making it even more challenging for start-ups to break into the market.

      Digital Data Marketplaces: A Game Changer

      Centralised data repository platforms like the Snowflake Marketplace are breaking down these barriers. By providing a centralised, easily accessible marketplace for data acquisition and use, these platforms are significantly reducing the time and capital required for start-ups to get their operations off the ground. Start-ups no longer need to invest in expensive data scraping techniques or negotiate with multiple data providers; a treasure trove of valuable information is now just a few clicks away.

      Speeding Up Time-to-Market

      With the availability of easy-to-use data, proptech start-ups and established businesses can accelerate their development cycles. Time-to-market is a critical factor for any business, and in a sector as dynamic as real estate, this could not be more crucial. Platforms like Snowflake have enabled proptechs to launch and iterate products faster, making it easier to adapt to market needs, and more readily generate property solutions – including bringing affordable housing to the public.

      Democratising investment opportunities

      Driving Policy with Public-Private Partnerships

      Easier access to data may stimulate public-private partnerships. Governments can leverage the insights generated by proptechs to guide policy decisions, be it in the form of zoning laws, tax incentives, or housing grants. With readily available data, these decisions can be made quicker and with more precision, ultimately benefitting the housing market at large.

      Security and Governance

      While data marketplace platforms make data more accessible, they also prioritise data security and governance. Reputable platforms will feature and document industry-leading controls and protocols to ensure high levels of governance for account holders and users, as well as all the data which is stored and accessed.

      An “Even” Data Playing Field

      When considering any “off-the-shelf” data from centralised data repositories, users benefit from a streamlined data acquisition process. This grants users access to a wealth of re-usable data offered by data providers, contributing to an even playing field as democratised data is universally available.

      For tailored requirements, some data providers on Snowflake Marketplace make certain data products available by request.

      Regardless of how you acquire the data, it is ultimately what you do with it that will derive the most meaning and value.

      Whether it be the basis for automation and AI, personalisation, analysis and insights, the integration of that data forms the foundation for informed business decision making, innovation and progress.

      The Data Revolution

      The democratisation of data through platforms is a necessity for driving innovation in Australia’s housing market. By eliminating barriers to entry, these platforms allow organisations to focus on what they do best. In an industry begging for disruption, this newfound accessibility to data sets the stage for a seismic shift towards a more equitable and affordable housing landscape in Australia. The future looks promising, and much of that promise is driven by data.


      Read more from The Proptech Cloud

      What Is A Geohash And How Is It Used?

      Discover what a geohash is, how it works, and its real-world applications in mapping, logistics and data analysis.

      What Is A Cadastre?

      Learn how cadastres capture property boundaries, ownership details, and values, and see how technology is transforming them with 3D models, GIS and digital platforms.

      Top Property and Proptech Events in Australia 2025

      These industry events provide valuable opportunities to learn from industry leaders, explore emerging technologies, and network with peers who are shaping the future of the sector.

      The Shifting Landscape of Property Ownership in Australia

      Uncover the ways in which fintech and proptech are revolutionising property ownership in Australia, making it more accessible and dynamic than ever before.

      Parcels, Titles, Addresses and Properties. What’s The Difference?

      ​Parcels, titles, addresses and properties. These terms are often used interchangeably in real estate, but are they the same thing?