What is the Australian Statistical Geography Standard (ASGS)?
What is the Australian Statistical Geography Standard (ASGS)?
The Australian Statistical Geography Standard (ASGS) is essentially a framework used to classify and organise geographical areas across Australia for the purpose of collecting, analysing, and disseminating statistics.
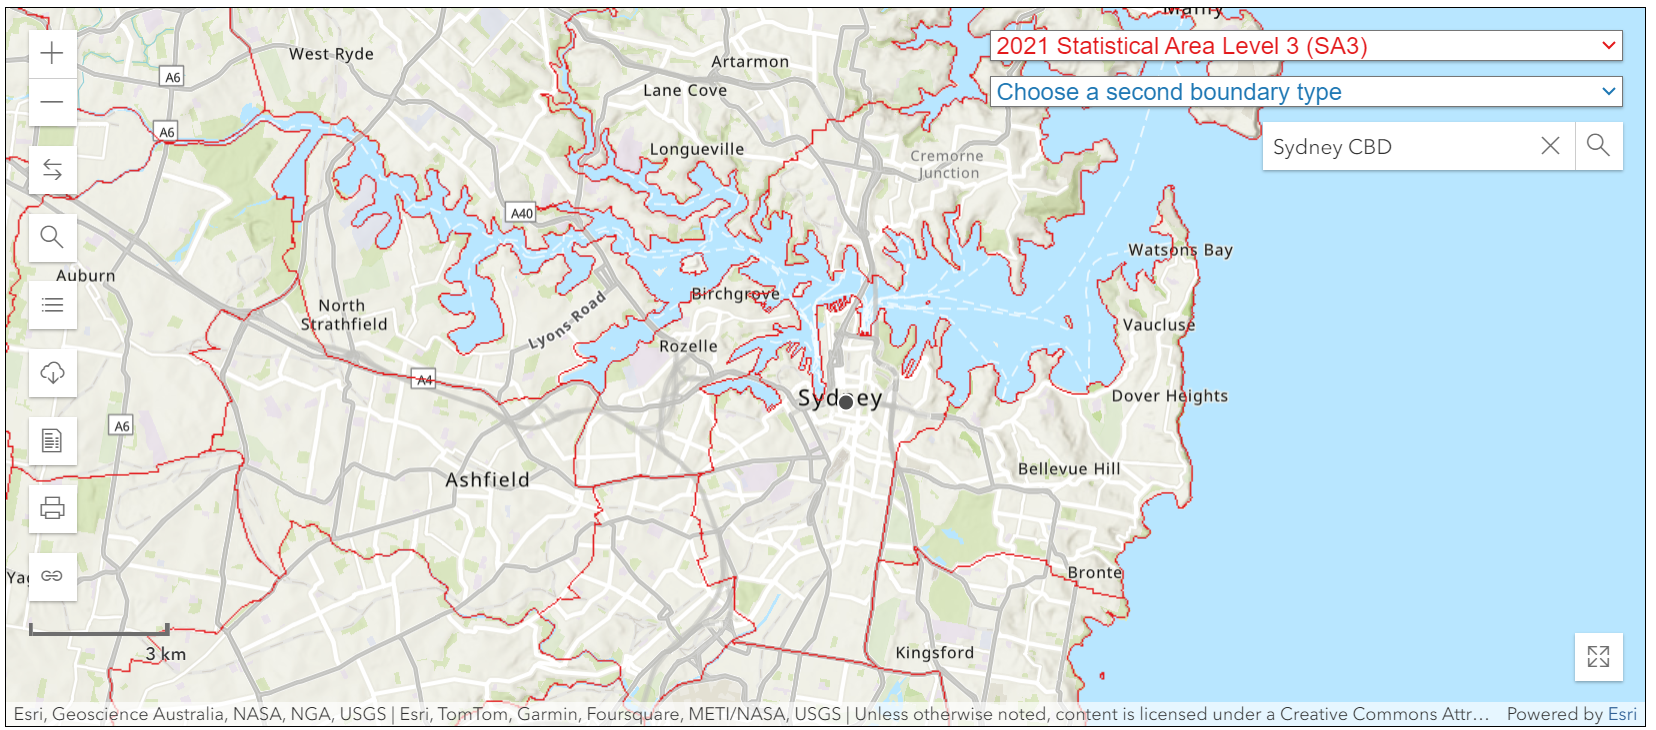
Edition 3 ASGS 2021 – Sydney Statistical Area 3 (SA3)
Source: ABS Maps
By organising Australia into a system of statistical areas, the ASGS can be used to perform standardised location-based analysis on things that matter to your business. For example, where your customers live or shop, where your competitors operate, where you have business assets located or where weather patterns are observed.
The ASGS is a detailed way of representing Australia’s geographical diversity in statistical data.
By dividing the country into hierarchical levels of statistical areas, ranging from broad regions to specific localities, it allows accurate and meaningful analysis of various data, including population, economic and environmental statistics – ultimately, to better understand where people live and how communities are formed.
The ASGS was introduced in 2011 to replace the previous Australian Standard Geographical Classification (ASGC).
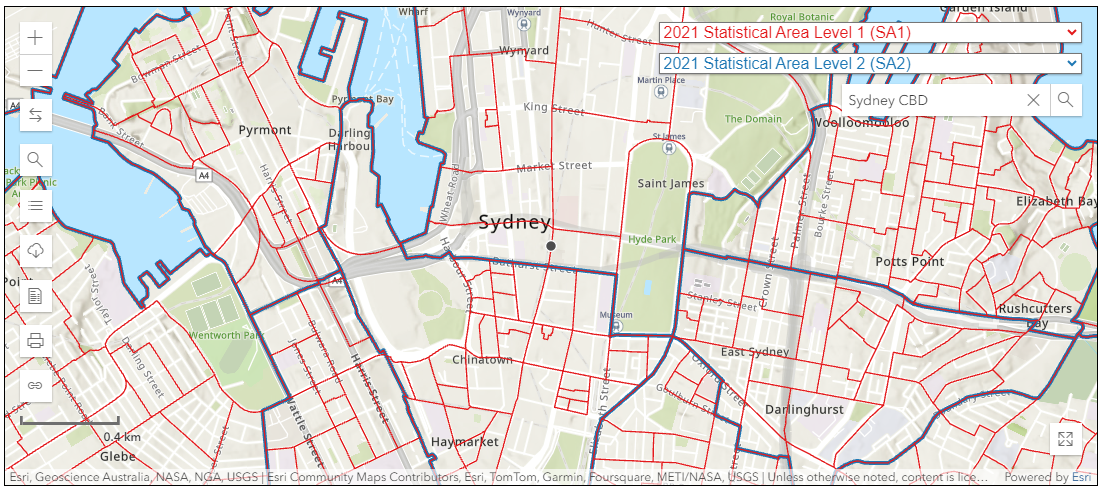
Edition 3 ASGS 2021 – Sydney Central Business District (CBD) Statistical Area 1 (SA1) and Statistical Area 2 (SA2).
Source: ABS Maps
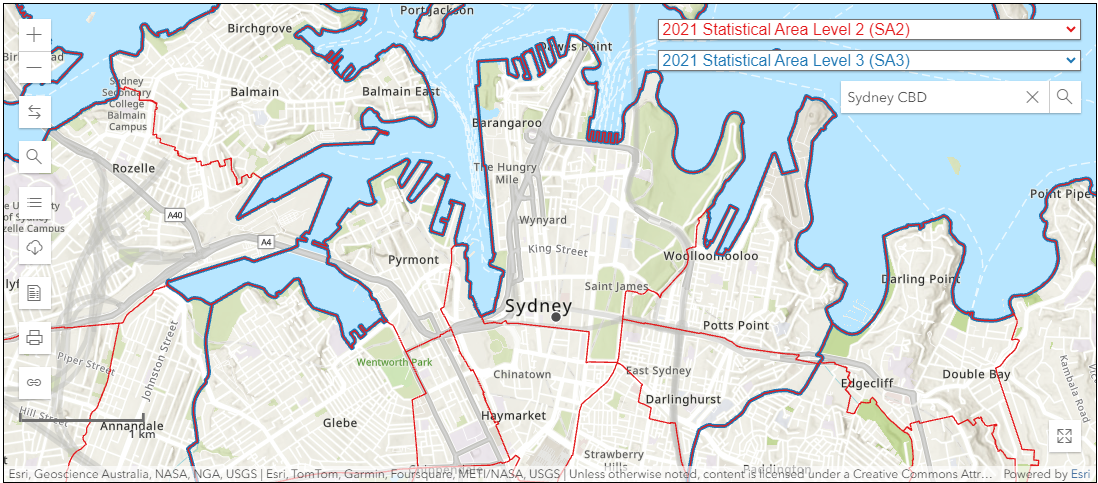
Edition 3 ASGS 2021 – Sydney CBD Statistical Area 2 (SA2) and Statistical Area 3 (SA3).
Source: ABS Maps
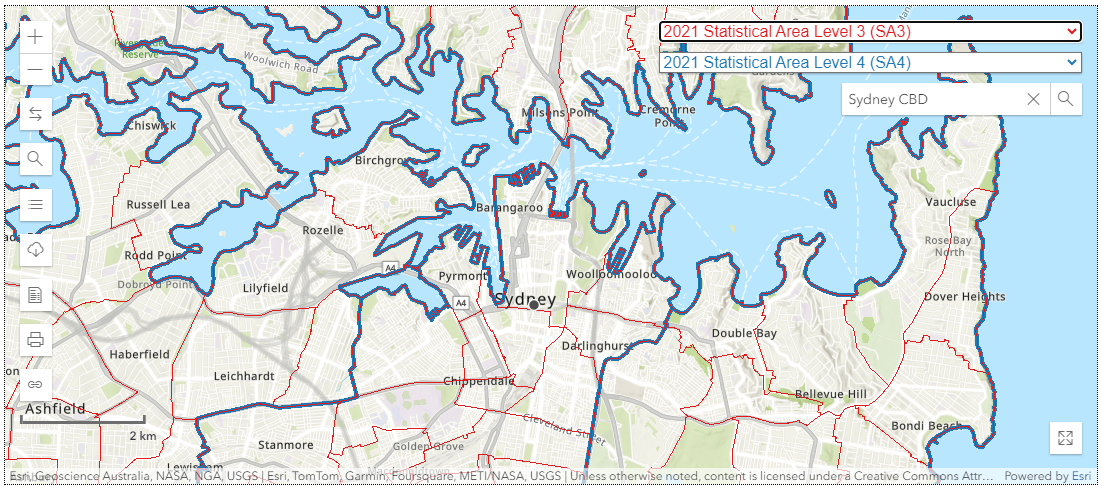
Edition 3 ASGS 2021 – Sydney CBD Statistical Area 3 (SA3) and Statistical Area 4 (SA4).
Source: ABS Maps
Updates of the Australian Statistical Geography Standard (ASGS)
The ASGS is revised and refreshed every five years to reflect changes in the population, demographics, the country’s development and geographic boundaries to ensure it remains relevant and useful for statistical purposes.
The third edition, linked to the 2021 Census, began rolling out in July 2021 and includes updates to various geographic categorisations, ending with the Remoteness Structure in March 2023.
The Australian Bureau of Statistics (ABS) oversees the ASGS and reviews it to ensure it meets current needs, incorporating feedback from public consultation. Additionally, they offer the online tool, ABS Maps, for exploring and comparing these statistical areas.
ASGS Edition 3 hierarchy of statistical areas
The Australian Statistical Geography Standard (ASGS) is represented through a hierarchical framework of statistical areas.
The ASGS is split into ABS and non ABS Structures. Of these, ABS Structures are geographies designed by the ABS for the purposes of releasing and the analysis of statistics.
The hierarchy is made up of several nested levels, which enables a flexible and consistent approach to understanding and managing geographic data.
Here is the ASGS Edition 3 Structures as published by the Australian Bureau of Statistics:
Main Structure and Greater Capital City Statistical Areas
- Mesh Blocks: The smallest geographic unit, designed to cover all of Australia without gaps or overlaps. Mesh Blocks are the building blocks for larger statistical areas. Read more about Mesh Blocks>
- Statistical Areas Level 1 (SA1): Groups of Mesh Blocks with populations between 200 and 800 people. They are used in the Census of Population and Housing.
- Statistical Areas Level 2 (SA2): Aggregates of SA1s, generally with populations between 3,000 and 25,000 people. They represent functional areas that interact socially and economically.
- Statistical Areas Level 3 (SA3): Groups of SA2s, reflecting regional cities and large urban transport hubs.
- Statistical Areas Level 4 (SA4): Aggregates of SA3s, representing labour markets or regions with similar socioeconomic characteristics.
- Greater Capital City Statistical Areas (GCCSA): Represent each of the eight state and territory capital cities.
Special Purpose Regions
Indigenous Structure
- Indigenous Regions and Areas: Defined to facilitate the statistical analysis of the distribution of Aboriginal and Torres Strait Islander populations. The three hierarchical levels are: Indigenous Locations, Indigenous Areas and Indigenous Regions.
Remoteness Structure
- Remoteness Areas: Classify areas based on their remoteness from services and population centres. The five remoteness classes are: Major Cities, Inner Regional, Outer Regional, Remote and Very Remote.
Significant Urban Areas, Section of State, Urban Centres and Localities
- Urban Centres and Localities (UCLs): Define urban and rural areas based on population size and density.
Section of State (SOS): SOS groups the UCLs into classes of urban areas based on population size.
Classifying urban areas in several different ways is to allow statistical data to be made available to Australian towns and cities and for statistical analysis.
Non ABS Structures
- Non ABS Structures: These are administrative regions that are not defined or maintained by the ABS. They include eight geographies: Local Government Areas, State Electoral Divisions, Commonwealth Electoral Divisions, Destination Zones, Postal Areas, Suburbs and Localities, Australian Drainage Divisions and Tourism Regions.
What tools can be used for representing and analysing ASGS?
These tools collectively offer a comprehensive approach to representing and analysing ASGS data.
They provide the necessary geographic context and detailed spatial data required for thorough analysis.
A combination of these resources can enable data professionals to enhance their analytical capabilities and produce insightful visualisations to support planning and informed decision making.
- ABS Maps: An online tool provided by the Australian Bureau of Statistics (ABS) that allows users to explore and compare different statistical areas defined by the ASGS.
- Geographic Information System (GIS) Files: GIS is a framework for gathering, managing, and analysing spatial and geographic data, encompassing a broad range of tools and functionalities. GIS files (formats may include shapefiles, GeoJSON, and KMLare) available for download, allowing for detailed spatial analysis using software like ArcGIS or QGIS.
- Online Data Portals: Platforms such as the ABS Data Explorer or Australian National Map provide access to a variety of geographic data layers. This allows users to visualise and download data in different formats for analysis.
- Statistical and Data Visualisation Software: R, Python (with libraries like Geopandas and Folium), and Tableau can be used to import ASGS data for advanced statistical analysis and visualisation, enabling the creation of custom maps and visual representations of the data.
- Spatial Databases: Databases such as PostGIS that are optimised for storing and querying spatial data and facilitates efficient management and analysis of large geographic datasets.
- Printed Maps and Documentation: Detailed maps and explanatory notes published by the ABS, outlining the boundaries and characteristics of each statistical area.

What is the ASGS used for?
One of ASGS’s primary uses is for the Census, the study of Australia’s population.
The ASGS is integral to Australia’s Census as it defines geographic boundaries, facilitates detailed data collection and enumeration, enables comprehensive data analysis and reporting, and supports informed decision-making, resource allocation, policy making and planning by government agencies.
However it is also used broadly by the Australian Bureau of Statistics (ABS) and other entities.
The ASGS is versatile enough to support a wide array of activities involving the accurate collection of geographic and statistical data across Australia, making it a fundamental element in analysis.
- Detailed demographics: The ASGS allows businesses to segment customers based on detailed geographic and demographic data. By using Statistical Areas (SA1 to SA4), companies can identify distinct customer groups within specific regions, tailoring marketing strategies and product offerings to the unique characteristics of each segment.
- Targeted marketing: Businesses can use Mesh Blocks or SA1 regions to create hyper-local marketing campaigns, ensuring that promotional efforts are targeted towards areas with the highest potential for engagement and conversion.
- Real estate and urban planning: The ASGS provides a robust framework for organising geographic areas to satisfy a broad range of uses in real estate. It can be used to enhance analysis of localities for a better understanding of local demographic through to reporting of property-related data. Examples include: analysis of housing trends, planning of urban developments, identifying growth areas or conducting property valuations with a clear understanding of geographic distinctions.
- Accurate market data aggregation: The hierarchical structure of the ASGS enables businesses to aggregate and report market data accurately across various geographic levels, from local neighborhoods (SA1) to larger regions (SA4). This helps in understanding market trends and consumer behavior across different areas.
- Market trend analysis: By comparing data across different Census periods using consistent ASGS boundaries, businesses can track market trends and demographic shifts, aiding in long-term strategic planning and investment decisions.
- Business and market analysis: Companies leverage the ASGS for market analysis, site selection and strategic planning as it can help businesses understand demographic trends and geographical distributions of markets to inform targeted marketing and business expansion strategies.
- Retail demand forecasting: Retailers can use ASGS data to forecast demand for products in different geographic areas. By understanding population density, age distribution, and income levels within mesh blocks or SA2 areas, businesses can optimise inventory levels to match local demand.
- Supply chain efficiency: The ASGS framework helps retailers plan efficient distribution routes and manage stock levels more effectively, ensuring that products are available where they are needed most without overstocking or stockouts.
- Competitor analysis: Businesses can use ASGS-defined regions to map out the geographic locations of competitors, analysing their market coverage and identifying potential gaps or opportunities for expansion.
- Market share estimation: By integrating ASGS data with sales and demographic information, companies can estimate market share within specific regions, helping to assess competitive strengths and weaknesses.
- Environmental risk assessment: The ASGS allows for precise mapping of environmental risks such as flood zones, bushfire-prone areas, and pollution levels. By overlaying environmental data with population and infrastructure data from the ASGS, businesses can assess the potential impact of environmental risks on their operations.
- Environmental regulation compliance and planning: Companies can use ASGS data to ensure compliance with environmental regulations and to plan mitigation strategies for at-risk areas. This helps in safeguarding assets and maintaining operational continuity.
- Research and academia: Researchers and academics use the ASGS for conducting spatial analysis and regional studies, allowing detailed investigations into socio-economic, environmental, and demographic conditions across different regions.
The essential role of ASGS
The Australian Statistical Geography Standard (ASGS) plays a foundational role in statistical geography, allowing users to analyse and visualise statistics based on location. Its extensive applications, regular updates, and strong endorsement by the ABS ensure its implementation and integrity.
As such, the ASGS remains an essential framework and a mainstay in Australian geographic and statistical analysis—an indispensable tool for ensuring the accuracy, consistency, and relevance of geographic data across various domains.
How to Incorporate Mesh Blocks into Datasets
Incorporating mesh blocks into datasets involves several steps to ensure seamless integration and effective utilisation of geographical information. Here’s a guide on how to incorporate mesh blocks into datasets.
Subscribe to our newsletter
Subscribe to receive the latest blogs and data listings direct to your inbox.


