Environmental Risks in Real Estate: Essential Metrics for Assessment
Driven by greater awareness and demand, environmental considerations are increasingly at the forefront of property development and investment.
Environmental factors can significantly impact site selection, regulatory compliance, property values, safety, infrastructure, sustainability, insurance costs, and the overall desirability of real estate.
To adequately build resilient properties for our future, understanding and assessing environmental risks in real estate is crucial.
Examining the key metrics and statistics used to measure these risks can also provide valuable insights for property stakeholders who are building climate intelligence as a means of value creation and strategic differentiation in the real estate industry.
On the other hand, the real estate industry contributes approximately 39% of total global emissions. This highlights how factors as broad as the choice of building materials, construction methods, real estate planning and development can influence and help to mitigate global climate change and environmental risk.
Environmental assessment metrics provide important intel to stakeholders and businesses in and around the real estate industry.
Here we examine the top 16 key metrics used in assessing environmental risk in real estate.
1. Flood Risk Assessment
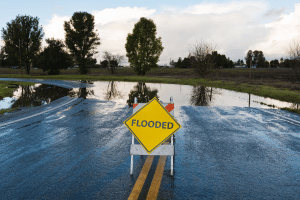
Managing flood risk is an important aspect of adapting to global climate change and flood risk assessments have become an important part of risk management practices. The estimation of risk is somewhat challenging and involves careful consideration of a number of varying factors such as location, historical flood data, and elevation.
Flood risk is a concern, especially for properties near water bodies.

2. Earthquake Risk Score
In earthquake-prone areas, earthquake risk score is vital. It evaluates the probability of earthquakes and their potential impact, factoring in seismic activity and building standards.
Earthquake risk metrics can support stakeholders in developing risk reduction measures such as emergency response plans, building design codes, or insurance-related decisions.
3. Wildfire Risk Rating
Properties in or near wilderness areas must consider the risk of wildfires. This rating looks at location, vegetation, and climate conditions. There are a number of data and solutions in the market that help decision makers with deeper location intelligence insights, such as CoreLogic with their climate risk solutions and Precisely with their wildfire risk data.
Then there are those protech innovators who actively incorporate environmental risks into their solutions, such as Nearmap who’ve recently acquired BetterView, will also be integrating risk ratings for data decisions given the ever-changing nature of bush fires, floods, and other disasters.
4. Storm Surge and Tsunami Risk
While storm surges and tsunamis are caused by different events, they both have the potential to cause significant harm and damage, such as substantial erosion of beaches and coastal highways, and waves pose a threat to boats and buildings along the shoreline. As the surging waters move inland, rivers and lakes may experience adverse effects, contributing to the escalation of flood levels.
Coastal properties are evaluated for their vulnerability to storm surge and tsunamis, crucial in today’s changing climate.

5. Sea Level Rise Projections
With climate change, assessing the long-term risk of sea level rise is essential for coastal real estate investments.
Climate Central’s Coastal Risk Screening Tool is a handy tool for quick future projections.
6. Air Quality Index (AQI)
Air pollution stands as the most significant environmental threat to global public health, resulting in an approximate annual total of 7 million premature deaths.
AQI impacts property desirability and occupant health, making it a significant factor in urban and industrial areas.
7. Soil Contamination Levels
Soil contamination can limit property use and affect value, necessitating thorough assessments.
Australian soil information is collected by government and held by the states and territories. Soil Science Australia, the national soil science body, shares a handy list of Soils Data, Maps and Information Sources for reference.

8. Water Quality Assessments
Our water systems, including surface and groundwater, catchments, as well as estuarine and marine bodies, constitute intricate ecological networks that we engage with daily. These waterways and wetlands play an important role in:
- Providing drinking water
- Supporting irrigation and agriculture
- Receiving and purifying effluent and stormwater
- Facilitating recreational and commercial activities such as fishing and boating.
The quality of local water sources is a key consideration, as it affects usability and desirability
9. Heat Island Effect
Urban areas influence the surrounding atmosphere and engage with climate processes, resulting in distinct microclimates within cities.
This heat island phenomenon leads to urban areas experiencing notably higher temperatures compared to their surroundings, particularly in areas with limited green cover and increased hard surfaces that absorb, retain, and emit heat.
Urban heat islands can increase energy costs and affect living conditions, and is an important factor in urban planning.
10. Noise Pollution Levels
The World Health Organization (WHO) recognises noise pollution—defined as unfavorable noise caused by human activity—as an underestimated threat that can cause a number of short- and long-term health problems.
As well as contributing to health, noise pollution is often seen as a less-than-desirable attribute contributing to liveability.
Properties exposed to high noise levels from traffic or industry can affect their value.
11. Environmental Regulation Compliance
In Australia, compliance with legislation including protection of threatened plants, animals and ecosystems, wildlife trade, hazardous waste, air quality and monitoring compliance with the conditions of approvals granted under the Environment Protection and Biodiversity Conservation Act 1999 (EPBC Act) is conducted by The Department of Climate Change, Energy, the Environment and Water.
Compliance with environmental regulations is critical to avoid legal issues and maintain property value.

12. Land Stability and Erosion Rates
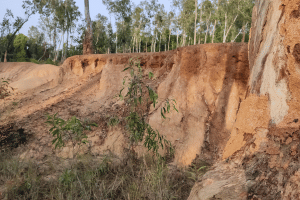
Land stability and erosion rates is affected by soils, surface cover, topography, and climate; all of which are interrelated.
Particularly in areas with unstable soils or steep terrain, assessing the risk of landslides or erosion is essential for many aspects of real estate such as site selection, development planning and insurance, while these risks can also have an influence on property valuations.
13. Proximity to Hazardous Facilities
Numerous research studies have indicated a correlation between living in close proximity to sites with hazardous wastes, industrial facilities, pesticide-treated cropland, busy roadways, nuclear power plants, and gas stations or repair shops, result in an increased likelihood of detrimental health effects.
Government may form regulations and implement procedures for permits and enforcement to limit pollution.
As such, properties in close proximity may face increased regulations, risks or insurance costs.
14. Biodiversity and Wildlife Protection Areas
With a sustained need for housing, urban planners and conservation managers are consistently exploring alternative strategies for residential development that aim to reduce adverse effects on biodiversity and ecosystem functioning.
Thus, proximity to protected areas can limit development options and affect property value.

15. Carbon Footprint Analysis
Climate change is already underway, with an escalating impact that is increasingly affecting all of us around the globe.
Without immediate and systemic action to address its destructive consequences, the impact is expected to be substantial.
For greater visibility into the environmental footprint of transactions and impacts of our consumption and production activities, organisations such as FootprintLab provide current, credible and commercially ready carbon data. This information can aid consumers, producers and governments in decision-making that aligns with their sustainability goals.
Managing carbon emissions from the construction industry is one crucial step in limiting these effects on climate change and a property’s carbon footprint is becoming a significant factor in light of global climate concerns.
16. Sustainability Certifications
A green building certification is a verification process ensuring that a building is designed and constructed to enhance energy efficiency, decrease water usage, foster a healthier indoor environment, manage resources and waste effectively, and limit environmental impact.
The process generally requires adherence to specific guidelines and criteria, often assessed by an accredited third-party organisation, leading to the certification of the building.
There are different green building certifications around the globe, with LEED in the United States, BREEAM in the United Kingdom and NABERS in Australia, each with its own set of criteria and scoring systems.
Properties with these certifications are often seen as less risky and more desirable.
The Proptech Cloud’s Environment and Energy Efficiency Data provides energy supply data and NABERS energy rating data to guide decisions on energy sourcing as part of a robust sustainability strategy.
Managing Environmental Risks
Understanding and mitigating environmental risks is important in the real estate sector. By using these metrics, stakeholders can make informed decisions, adapt to environmental challenges, uncover business opportunities and invest in sustainable and resilient properties.
As the world continues to focus on environmental sustainability, these considerations will become increasingly integral to real estate assessment and development.
Subscribe to our newsletter
Subscribe to receive the latest blogs and data listings direct to your inbox.


